
Overview of methodologies and statistical strategies in observational studies and meta-analyses on the risk of hepatocellular carcinoma in patients with chronic hepatitis B on entecavir or tenofovir therapy

 , ...
, ... Abstract
Entecavir (ETV) and tenofovir disoproxil fumarate (TDF) are first-line antiviral therapies for patients with chronic hepatitis B (CHB) and reduce the risk of disease progression and liver-related complications, as well as improve survival by effectively suppressing viral replication. Nevertheless, since the first publication in 2019 on a lower risk of hepatocellular carcinoma (HCC) in Korean patients receiving TDF than those receiving ETV, the topic has remained a hot and unsettled debate. Multiple studies and meta-analyses have yielded conflicting results. As HCC takes time to develop, studies are mainly observational to benefit from a larger sample size and longer follow-up that provides a higher statistical power to compare the two treatments. However, TDF was available to CHB patients a few years later than ETV in most countries, thus leading to a difference in follow-up duration. Moreover, despite studying the same topic, the difference in data sources and available parameters, inclusion and exclusion criteria, and use of statistical methods complicated the interpretation and comparison of the findings and contributed to between-study heterogeneity in meta-analyses. This review describes some caveats in interpreting and comparing the results from these observational studies and meta-analyses. Future studies should explore better designed observational studies with high-quality data sources, and aggregation of patient data in meta-analysis to tackle between-study heterogeneity.
Keywords
INTRODUCTION
Entecavir (ETV) and tenofovir disoproxil fumarate (TDF) are currently recommended by all the international guidelines as the first-line antiviral treatments for patients with chronic hepatitis B (CHB) who fulfill treatment criteria[1-3]. However, starting from the publication by Choi et al.[4] in 2019 which reported a lower risk of hepatocellular carcinoma (HCC) among TDF-treated patients than ETV-treated patients, a hot debate on whether ETV and TDF differ in HCC prevention has been initiated. Since then, numerous studies and meta-analyses have been performed[5-8]. Till now, the debate remains unresolved. It is expected that more studies will continue to be performed until there is enough evidence to draw a conclusion. While many studies have been done, the methodology and statistical strategies used are heterogeneous, which may affect how clinicians and researchers understand, compare, and combine findings from different studies. In this review, we summarize and compare different methodologies and statistical strategies that were applied in the previous studies on comparing ETV and TDF on HCC risk, and their impact on data interpretation and data aggregation.
METHODOLOGY USED IN PREVIOUS STUDIES COMPARING ETV AND TDF ON HCC RISK
Data source
Most of the studies comparing ETV and TDF on the risk of HCC development are based on observational data. The common data sources included hospital-based clinical cohorts, administrative claims databases, and electronic health record databases[7]. Tseng et al.[7] demonstrated in their meta-analysis that the effect estimates can differ depending on the data sources. In particular, CHB patients who were treated by ETV or TDF did not have a statistically significant difference in the incidence of HCC in the subgroup analysis of eleven hospital-based clinical cohorts [adjusted hazard ratio (aHR) = 1.03, 95% confidence interval (CI): 0.88-1.21; I2 = 0%][7]. Here, I2 statistic quantifies the percentage of the variability in effect estimates that is due to heterogeneity rather than random error; a small I2 statistic indicates little heterogeneity. In contrast, the effect estimates favor the use of TDF over ETV in two administrative database studies without laboratory data (aHR = 0.67, 95%CI: 0.59-0.76; I2 = 0%), as well as two electronic health record databases with laboratory data (aHR = 0.69, 95%CI: 0.25-1.90; I2 = 0%)[7]. Observational studies often allow a large sample size to provide sufficient statistical power to test for the difference in treatments on long-term clinical outcome. However, depending on the data sources, studies can suffer from different extent of biases including selection bias, and residual confounding bias when some important confounders are not captured. It is essential to understand the limitations and better identify all possible confounding factors that can mask the true treatment effect.
Inclusion and exclusion criteria
Inclusion and exclusion criteria are critical for defining a study population that represents the target population. Poorly designed inclusion and exclusion criteria can lead to selection bias and low generalizability. Some major differences in the inclusion and exclusion criteria of the previous studies include the study period, the inclusion of treatment-experienced patients, and the inclusion of patients with decompensated liver cirrhosis. In many countries where the previous studies came from, ETV was available some years before TDF. This caused an imbalance in the follow-up duration of the two treatment groups, especially in some earlier studies. Moreover, some studies may have different inclusion periods for ETV and TDF due to availability of the data [Table 1].
List of the methodologies used in published full articles between Dec 2018 and Oct 2021 on comparison between entecavir (ETV) and tenofovir disoproxil fumarate (TDF) on the risk of hepatocellular carcinoma (HCC) after the publications by Kim et al.[41] and Choi et al.[4]
| Ref. | Number of ETV- & TDF-treated patients (study period)a | Inclusion of patients with decompensated cirrhosis (% in the cohort) | Mentioned about missing data handling (method adopted) | Use of competing risk analysis | Use of propensity score (balancing strategy) | Variables included in the propensity scoreb | Conclusion TDF vs. ETV HR (95%CI) |
| Kim et al.[41] 2018 | ETV (n = 721): 1/2007-4/2017 TDF (n = 604): 1/2007-4/2017 | No | Yes (complete case analysis) | No | Yes (matching) | 1, 2, 3, 4, 7, 8, 9, 10, 11, 12, 13, 14, 17, 18, 19 | Matching: 0.74 (0.39-1.39) P = 0.340 |
| Choi et al.[4] 2019 Nationwide cohort | ETV (n = 11,464): 1/2012-12/2014 TDF (n = 12,692): 1/2012-12/2014 | Yes (3.7%) | Yes (multiple imputation) | Yes | Yes (matching) | 1, 2, 3, 4, 7, 25, 47, 53 | Matching: 0.68 (0.60-0.78) P < 0.001 |
| Choi et al.[4] 2019 Hospital cohort | ETV (n = 1680): 1/2010-12/2016 TDF: (n = 1,141): 1/2010-12/2016 | Yes (59.9%, both compensated and decompensated) | Yes (multiple imputation) | Yes | Yes (matching, weighting) | 1, 2, 3, 4, 7, 8, 9, 10, 11, 14, 17, 18, 19, 28, 29, 30, 31, 32, 36 | Matching: 0.68 (0.46-0.99) P = 0.04 Weighting: 0.68 (0.46-0.99) P = 0.045 |
| Kim et al.[5] 2019 | ETV (n = 1484): 1/2012-12/2014 TDF (n = 1413): 1/2012-12/2014 | No | No | No | Yes (matching, weighting) | 1, 2, 3, 5, 7, 8, 9, 10, 19 | Matching: 1.02 (0.77-1.35) P = 0.884 Weighting: 1.00 (0.77-1.29) P = 0.988 |
| Yip et al.[6] 2020 | ETV (n = 28,041): 1/2008-6/2018 TDF (n = 1309): 1/2008-6/2018 | Yes (4.7%) | Yes (multiple imputation) | Yes | Yes (matching, weighting) | 1, 2, 3, 4, 7, 8, 9, 10, 11, 14, 17, 18, 19, 36, 40, 45, 51 | Matching: 0.39 (0.18-0.84) P = 0.016 Weighting: 0.36 (0.16-0.80) P=0.013 |
| Hsu et al.[42] 2020 | ETV (n = 4837) TDF (n = 700) | Yes (10.7%) | Yes (complete case analysis) | Yes | Yes (matching) | 1, 2, 3, 4, 6, 8, 11, 18, 19, 41 | Matching: 0.89 (0.41-1.92) P = 0.77 |
| Lee et al.[43] 2020 | ETV (n = 1439): 2/2007-1/2019 TDF (n = 1583): 2/2007-1/2019 | No | Yes (multiple imputation) | Yes | Yes (matching, weighting) | 1, 2, 3, 7, 8, 9, 10, 11, 12, 13, 15, 16, 17, 18, 19, 24, 26, 27, 28, 39, 48, 52 | Matching: 1.03 (0.70-1.51) P = 0.880 Weighting: 0.97 (0.68-1.38) P = 0.866 |
| Ha et al.[44] 2020 | ETV (n = 921): 11/2008-12/2017 TDF (n = 419): 11/2008-12/2017 | No | No | Yes | Yes (matching, weighting) | 1, 2, 3, 4, 8, 9, 10, 11, 12, 13, 15, 18, 19, 20, 24, 40 | Matching: 1.84 (0.90-3.79) P = 0.088 Weighting: 1.30 (0.81-2.10) P = 0.276 |
| Oh et al.[45] 2020 | ETV (n = 753): 1/2011-1/2014 TDF (n = 807): 12/2012-12/2015 | Yes (6.9%) | No | No | Yes (matching) | 1, 2, 3, 4, 6, 7, 8, 9, 10, 13, 14, 18, 19, 27, 28, 34, 35, 37 | Matching: 1.30 (0.80-2.02) P = 0.295 |
| Papatheodoridis et al.[11] 2020 | ETV (n = 772): Before 12/2012 TDF (n = 1163): Before 12/2012 | No | No | No | No | N.A. | Multivariable analysis 0.93 (0.55-1.56) P = 0.791 |
| Chen et al.[12] 2020 | ETV (n = 993): 1/2008-12/2018 TDF (n = 567): 1/2008-12/2018 | Yes (15.4%) | Yes (multiple imputation) | No | Yes (matching, weighting) | 1, 2, 3, 6, 7, 8, 9, 10, 11, 12, 13, 14, 18, 19, 26, 27, 34, 44 | Matching: 0.66 (0.46-0.95) P = 0.023 Weighting: 0.73 (0.54-0.98) P = 0.038 |
| Hu et al.[46] 2020 | ETV (n = 678): 1/2008-3/2018 TDF (n = 216): 1/2008-3/2018 | No | Yes (complete case analysis) | No | Yes (matching) | 1, 9, 13, 18, 34, 42, 49 | Matching: 0.66 (0.38-1.14) P = 0.141 |
| Su et al.[13] 2021 | ETV (n = 2193): 3/2005-12/2016 TDF (n = 1094): 8/2008-12/2016 | Yes (8.6%) | Yes (categorical variables that indicated if patients had missing data) | Yes | Yes (weighting) | 1, 2, 3, 4, 6, 8, 9, 10, 11, 12, 14, 17, 18, 19, 21, 22, 24, 33, 39, 50, 54 | Weighting: 1.00 (0.76-1.32)c |
| Shin et al.[47] 2021 | ETV (n = 1955): 1/2007-1/2018 TDF (n = 1731): 1/2007-1/2018 | No | Yes (multiple imputation) | Yes | Yes (matching, weighting) | 1, 2, 3, 4, 7, 8, 9, 10, 11, 14, 17, 18, 19, 29, 30, 31, 32 | Matching: 0.77 (0.46-1.29) P = 0.319 Weighting: 0.69 (0.43-1.11) P = 0.124 |
| Na et al.[48] 2021 | ETV (n = 671): 6/2012-12/2015 TDF (n = 665): 6/2012-12/2015 | Yes (10.8%) | Yes (multiple imputation) | No | Yes (matching, weighting) | 1, 2, 4, 8, 9, 11, 15, 18, 19, 23, 34, 58 | Matching: 1.02 (0.68-1.52) P = 0.940 Weighting: 1.11 (0.74-1.66) P = 0.620 |
| Güzelbulut et al.[23] 2021 | ETV (n = 248): 1/2007-12/2018 TDF (n = 359): 1/2007-12/2018 | Yes (6.1%) | No | No | No | N.A. | Multivariable analysis: 0.66 (0.24-1.80) P = 0.414 |
| Choi et al.[34] 2021 Cohort 1 | ETV (n = 21,486): 1/2013-12/2017 TDF (n = 54,799): 1/2013-12/2017 | Yes (34.4%, both compensated and decompensated) | No | No | Yes (matching) | 1, 2, 3, 4, 7, 38, 40, 46 | Matching: 0.93 (0.86-1.01) P = 0.081 |
| Choi et al.[34] 2021 Cohort 2 | ETV (n = 19,871): 1/2012-12/2014 TDF (n = 19,871): 1/2012-12/2014 | Yes (34.7%, both compensated and decompensated) | No | No | Yes (matching) | 1, 2, 3, 4, 7, 38, 40, 46 | Matching: 0.85 (0.79-0.91) P < 0.001 |
| Pol et al.[14] 2021 | ETV (n = 814): 8/2012-12/2015 TDF (n = 986): 8/2012-12/2015 | No | Yes (missing covariate values were handled using indicators for missing data in the multivariate model) | No | Yes (weighting) | 1, 2, 3, 7, 8, 9, 11, 12, 13, 15, 18, 24, 27, 39, 43, 44, 55, 56, 57 | Weighting: 1.24 (0.49-3.13)c |
| Chang et al.[15] 2021 | ETV (n = 5348): 1/2011-10/2018 TDF (n = 1900): 1/2011-10/2018 | Yes (66.5%) | Yes (complete case analysis) | No | Yes (matching, weighting) | 1, 2, 3, 4, 8, 9, 10, 11, 12, 13, 14, 26, 27, 28, 33 | Matching: 0.83 (0.65-1.06) P = 0.129 Weighting: 0.86 (0.69-1.06) P = 0.149 |
Moreover, channeling bias can exist whenever the time of introduction of two treatments with a similar indication is different. Channeling bias is a confounding bias that occurs when a newly registered drug and an established drug are preferentially prescribed to patients with different baseline clinical characteristics[9,10]. That usually occurs when a new drug becomes available; clinicians tend to start the new drug or switch the old drug to the new drug in patients for whom the old treatment is less effective. This can result in a less favorable clinical profile of the patients who started the new drugs. On the other hand, there exist some additional differences in the baseline clinical characteristics between ETV- and TDF-treated patients due to indications. For instance, clinicians may prioritize patients with advanced age, as well as renal and bone problems to ETV over TDF treatment due to safety issues. Also, pregnant women who required antiviral treatment receive TDF but not ETV during pregnancy. A way to exclude pregnant women who will stop antiviral treatment after delivery would be to include only CHB patients on at least 1 year of antiviral therapy. To handle channeling bias, it is important to adjust for the difference in baseline clinical characteristics between the patients by various statistical methods. Another direct way to address channeling bias is to restrict the start of the study period until both drugs are approximately equally available for the patients. This may however be hard to implement due to the reduced sample size and statistical power. On the other hand, some studies included patients who received other nucleos(t)ide analogues before the use of ETV or TDF[11-15]. As some patients were switched from previous nucleos(t)ide analogues to TDF, that can result in a much longer total treatment duration and potentially a more notable reduction in HCC.
In the meta-analysis by Choi et al.[8], they showed that the inclusion of decompensated cirrhosis was a source of heterogeneity between studies. They demonstrated that TDF treatment is associated with a lower incidence of HCC than ETV treatment in nine studies that included patients with decompensated cirrhosis (aHR = 0.69, 95%CI: 0.55-0.85; I2 = 0%). In the other six studies that did not include patients with decompensated cirrhosis, the pooled effect estimate still favors TDF over ETV, yet did not reach statistical significance (aHR = 0.90, 95%CI: 0.76-1.06; I2 = 4%). Choi et al.[8] pointed out that patients with decompensated cirrhosis suffered from a high risk of HCC and can thus strengthen the statistical power of the studies to detect the treatment difference. As ETV and TDF treatments can benefit patients with decompensated cirrhosis from improved survival, they are thus a potential group of patients that can show the treatment effect and the potential treatment difference between ETV and TDF on the development of HCC[16-19]. In particular, Shim et al.[16] compared 55 ETV-treated patients with decompensated cirrhosis with 144 ETV-treated patients with compensated cirrhosis. They demonstrated that ETV provided a comparable benefit on virological, biochemical, and serological responses at 6 and 12 months to patients with decompensated cirrhosis as compared to patients with compensated cirrhosis. Patients with decompensated cirrhosis benefited from improved liver function after 12 months of ETV treatment[16]. Kumada et al.[19] also showed that antiviral treatment is associated with a reduced risk of liver-related mortality in 160 patients with decompensated cirrhosis. In existing studies, there was no clear agreement on whether decompensated cirrhosis should be included or not in the study population [Table 1].
STATISTICAL STRATEGIES USED IN PREVIOUS STUDIES COMPARING ETV AND TDF ON HCC RISK
Propensity score
In observational studies, treatment selection for the patients is not randomized but judged by the clinicians based on patients’ medical history. Thus, the baseline differences in the medical history of patients (i.e., confounding factors) have to be adjusted for before making a comparison between the patients receiving the two treatments. While multivariable regression is a direct way to model the relationship between treatments and clinical outcomes under the adjustment for other confounding factors, the use of propensity scores (PSs) has gained popularity in clinical studies over the past two decades[20]. To compare TDF and ETV treatment on HCC risk, PS models the use of TDF or ETV as the dependent variable and the measured confounding factors as the independent variables. PS is considered as a balancing score that balances the two treatment groups on their confounding factors. Traditionally, PS is estimated by binary logistic regression, while the use of machine learning classification algorithms such as decision tree and gradient boosting has also been studied to incorporate non-linear relationships between the confounding factors and the treatment assignment[21,22]. In this article, a cohort of 100 TDF-treated patients and 900 ETV-treated patients with chronic hepatitis B is simulated to illustrate the use of PS, PS matching/weighting algorithm, balance diagnostics of the distribution of clinical characteristics between ETV- and TDF-treated patients before and after PS matching/weighting, as well as the impact of the presence of competing risk on the estimation of cumulative incidence of HCC.
After PS is estimated, different statistical strategies including stratification, adjustment, weighting, and matching can be used to balance the clinical characteristics of the patients receiving different treatments [Figure 1A]. Most of the previous studies comparing ETV and TDF on HCC risk in CHB patients used PS matching and/or weighting as the strategies [Table 1], while two out of the 18 studies used solely multivariable regression instead of PS[11,23]. These two studies concluded that TDF-treated patients were not associated with a lower risk of HCC than ETV-treated patients. In PS matching, each TDF-treated patient is matched to one or multiple ETV-treated patients based on similar values of their PSs. A common matching algorithm is the nearest-neighbor matching within a pre-specified caliper distance that sets a restriction on the maximum difference between the PSs in each of the matched pairs [Figure 1B][24]. In PS weighting, weights for every subject are calculated based on their PS to create a weighted cohort in which the confounding factors are balanced [Figure 1C]. While different types of weighting methods have been proposed, average treatment effect (ATE) and average treatment effects on the treated (ATT) were the two commonly used methods in previous studies. If ETV treatment is the reference group, ATE represents the average effect of treatment of TDF vs. ETV in the whole study population of treated CHB patients, while ATT represents the average effect of treatment of TDF vs. ETV in CHB patients who received TDF treatment. Generally, ATE is used if every patient can potentially receive both ETV or TDF, whereas ATT is preferred when patients’ clinical characteristics are more likely to determine the treatment they received[25]. ATT is used in PS matching, while ATT or ATE can be used in PS weighting.
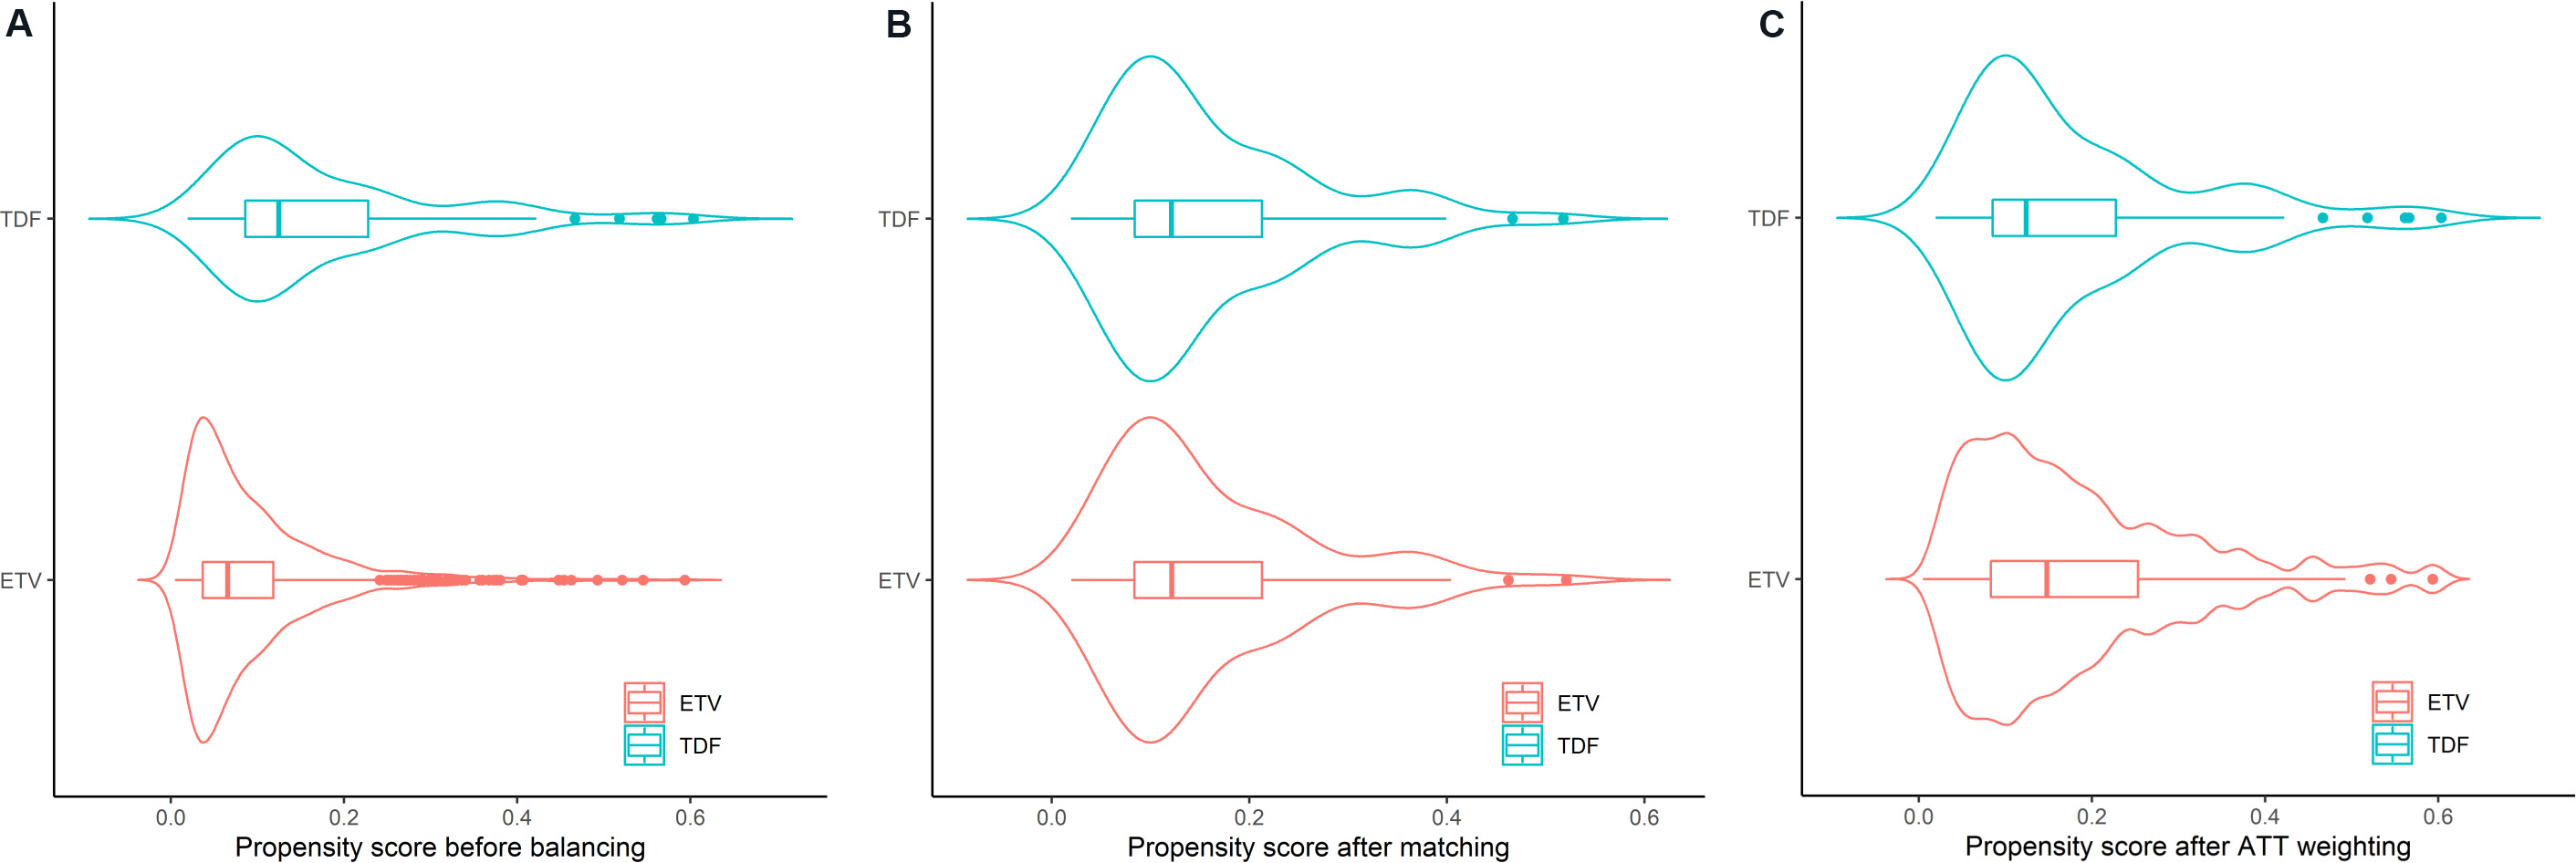
Figure 1. Violin plots of propensity score (PS) (A) before and after (B) 1:1 nearest neighbor matching (caliper of 0.1 standard deviations of the logit of PS) and (C) weighting using average treatment effect of the treated (ATT) in a simulated cohort of 100 tenofovir disoproxil fumarate (TDF)-treated patients and 900 entecavir (ETV)-treated patients with chronic hepatitis B. PS was estimated by logistic regression of seven covariates to predict the use of TDF.
One of the advantages of using PS over multivariable regression is that the balance of the distribution of clinical characteristics between treatments can be explicitly assessed and compared by balance diagnostics such as the absolute standardized mean difference after PS matching [Figure 2A], as well as PS weighting
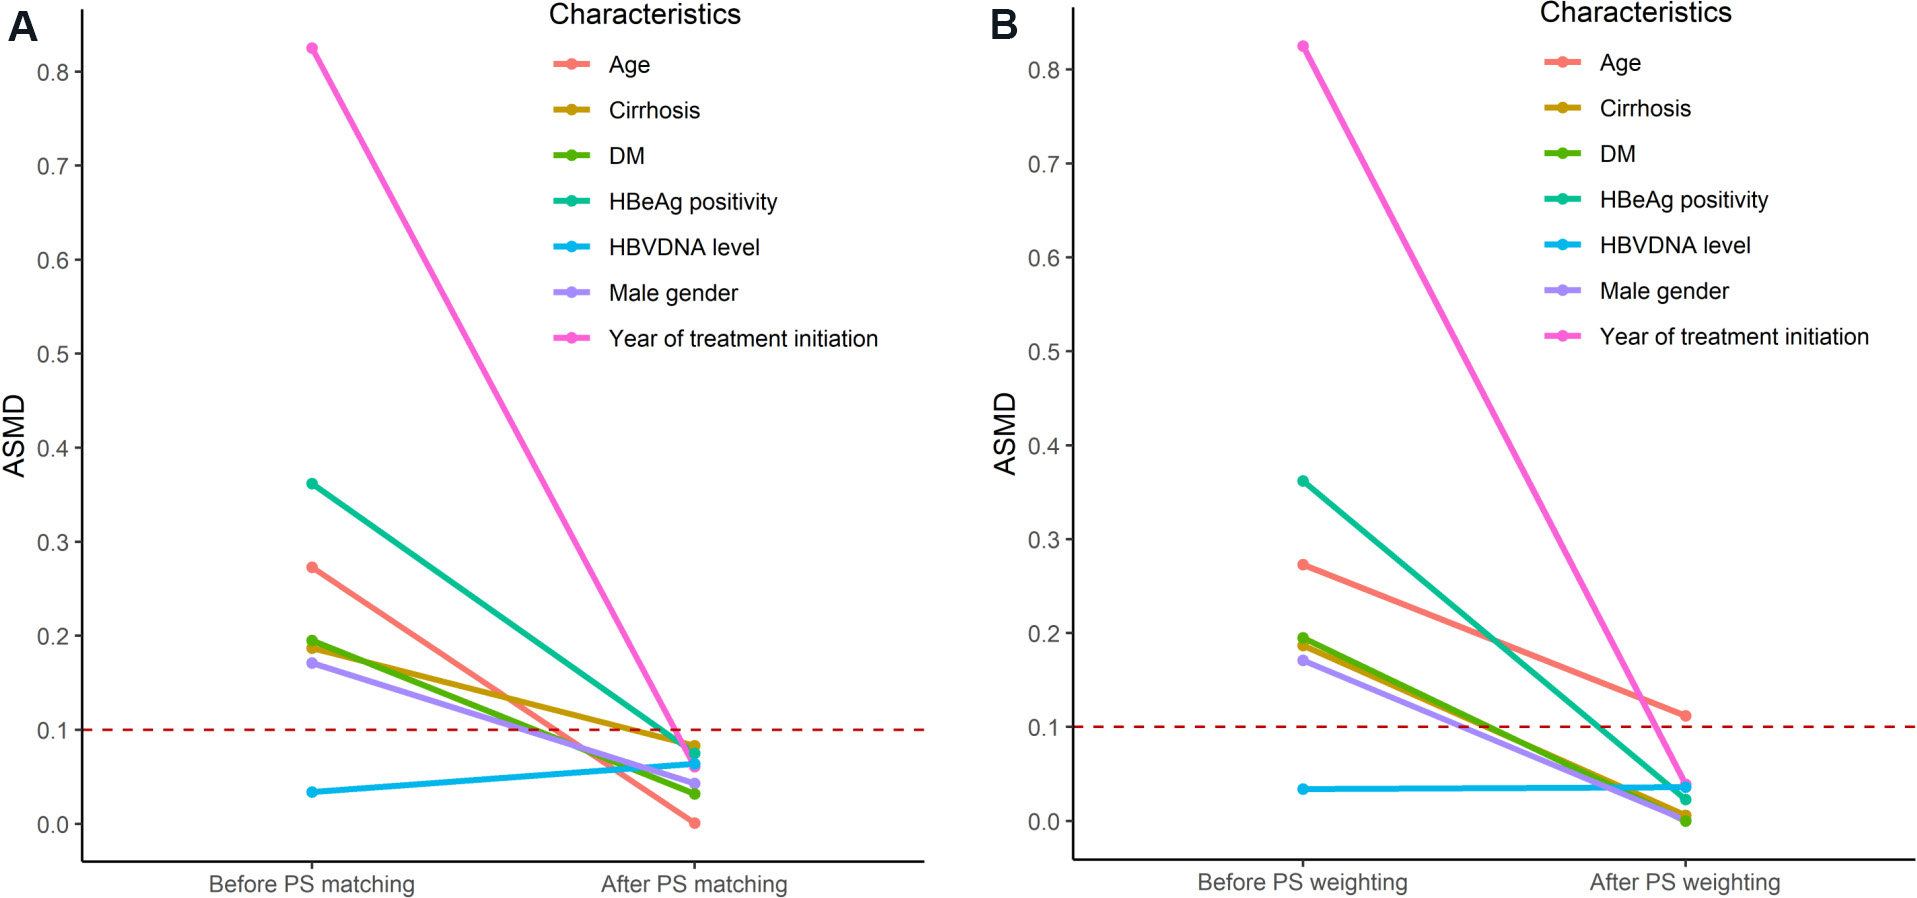
Figure 2. The change in absolute standardized mean difference (ASMD) of the seven clinical characteristics included in the propensity score (PS) in a simulated cohort of 100 tenofovir disoproxil fumarate (TDF)- and 900 entecavir (ETV)-treated simulated patients before and after (A) PS matching and (B) weighting. DM: Diabetes mellitus; HBeAg: hepatitis B e antigen; HBV: hepatitis B virus.
Missing data imputation
Missing data are common in observational studies[29]. If incomplete data are not handled appropriately, the studies can suffer from selection bias as well as a loss of statistical power and validity[30]. Multiple imputation is a widely adopted approach for handling missing data which gained popularity in recent years[31]. Unlike singular imputation which causes an underestimation of the data variability, multiple imputation preserves the uncertainty in the missing data by imputing the unobserved values multiple times[32]. Appropriate use of multiple imputation can reduce selection bias and improve precision when compared to complete case analysis, in which all records with missing data are excluded from the analysis[31]. There are three typical missing data mechanisms namely missing completely at random, missing at random, and missing not at random[33]. Missing at random indicates that the missing data of subjects are expected to be comparable to those with similar baseline characteristics who had complete data. Thus, multiple imputation can lead to an unbiased result as the missing data can be modeled based on those of similar subjects[33]. However, missing at random assumption may not always be valid so that a complete case analysis can be performed as a sensitivity analysis to examine the impact of multiple imputation on the results[30]. Regarding previous studies, some explicitly stated that multiple imputation or other methods were used to impute missing values, while 10 out of the 18 studies did not explicitly mention the management of missing data, or assumed that the missing data occurred randomly and performed complete case analysis as the main analysis [Table 1]. In the 10 studies, all except one of them showed that TDF treatment was not associated with a lower risk of HCC than ETV treatment[34]. The one that showed a significant result was claimed to be an inferior study design by the authors to demonstrate the impact of the unmatched year of treatment commencement[34].
Competing risk analysis
In time-to-event studies, some patients can experience events other than the clinical outcome of interest. For example, when we follow ETV- or TDF-treated patients for the development of HCC, some patients may die during follow-up due to different causes or receive liver transplantation due to hepatic decompensation. An event is a competing risk when its occurrence precludes or fundamentally hinders the chance of occurrence of the clinical outcome of interest[35]. When HCC is the outcome of interest, death and liver transplantation can be considered as competing risks. Failure to account for the presence of competing risk can lead to an overestimate of the cumulative incidence of the outcome of interest, or more seriously, an unreasonable conclusion. Figure 3A-C show the impact of the existence of competing risk on the estimation of cumulative incidence by the Kaplan-Meier method, which does not consider competing risk. When 20% of patients in the cohort had competing risk, the Kaplan-Meier method overestimated the cumulative incidence of HCC [Figure 3A]; the overestimation was amplified when 40% of patients in the cohort had competing risk [Figure 3B]. Instead, Gray’s method takes into account the presence of competing risk to estimate the cumulative incidence function. Of note, the proportion of patients with competing risk can also be different between treatment groups [Figure 3C]. A hypothetical example on the issue of ignoring competing risk would be when both treatments A and B do not affect the risk of HCC, yet treatment A causes more death than treatment B. When we compare treatments A and B on the incidence of HCC in CHB patients, if we ignore that treatment A causes more death, we may unreasonably recommend treatment A over treatment B as we will likely observe fewer HCC in treatment A than treatment B as those who died can never develop HCC. Some previous studies have accounted for competing risks of HCC in their analysis, which included death and/or liver transplantation [Table 1]. In analyzing time-to-event outcomes, some common semi-parametric models as an extension of the Cox proportional hazard model under the presence of competing risk are cause-specific hazard models and Fine-Gray subdistribution hazard model[36,37]. Cause-specific hazard model estimates the association of ETV vs. TDF with the rate of HCC occurrence in subjects who are currently event‐free (i.e., free of HCC and the competing events). The Fine-Gray model estimates subdistribution hazard ratio that represents the association of ETV vs. TDF with the cumulative incidence function of HCC or on the probability of HCC occurrence over time[37].
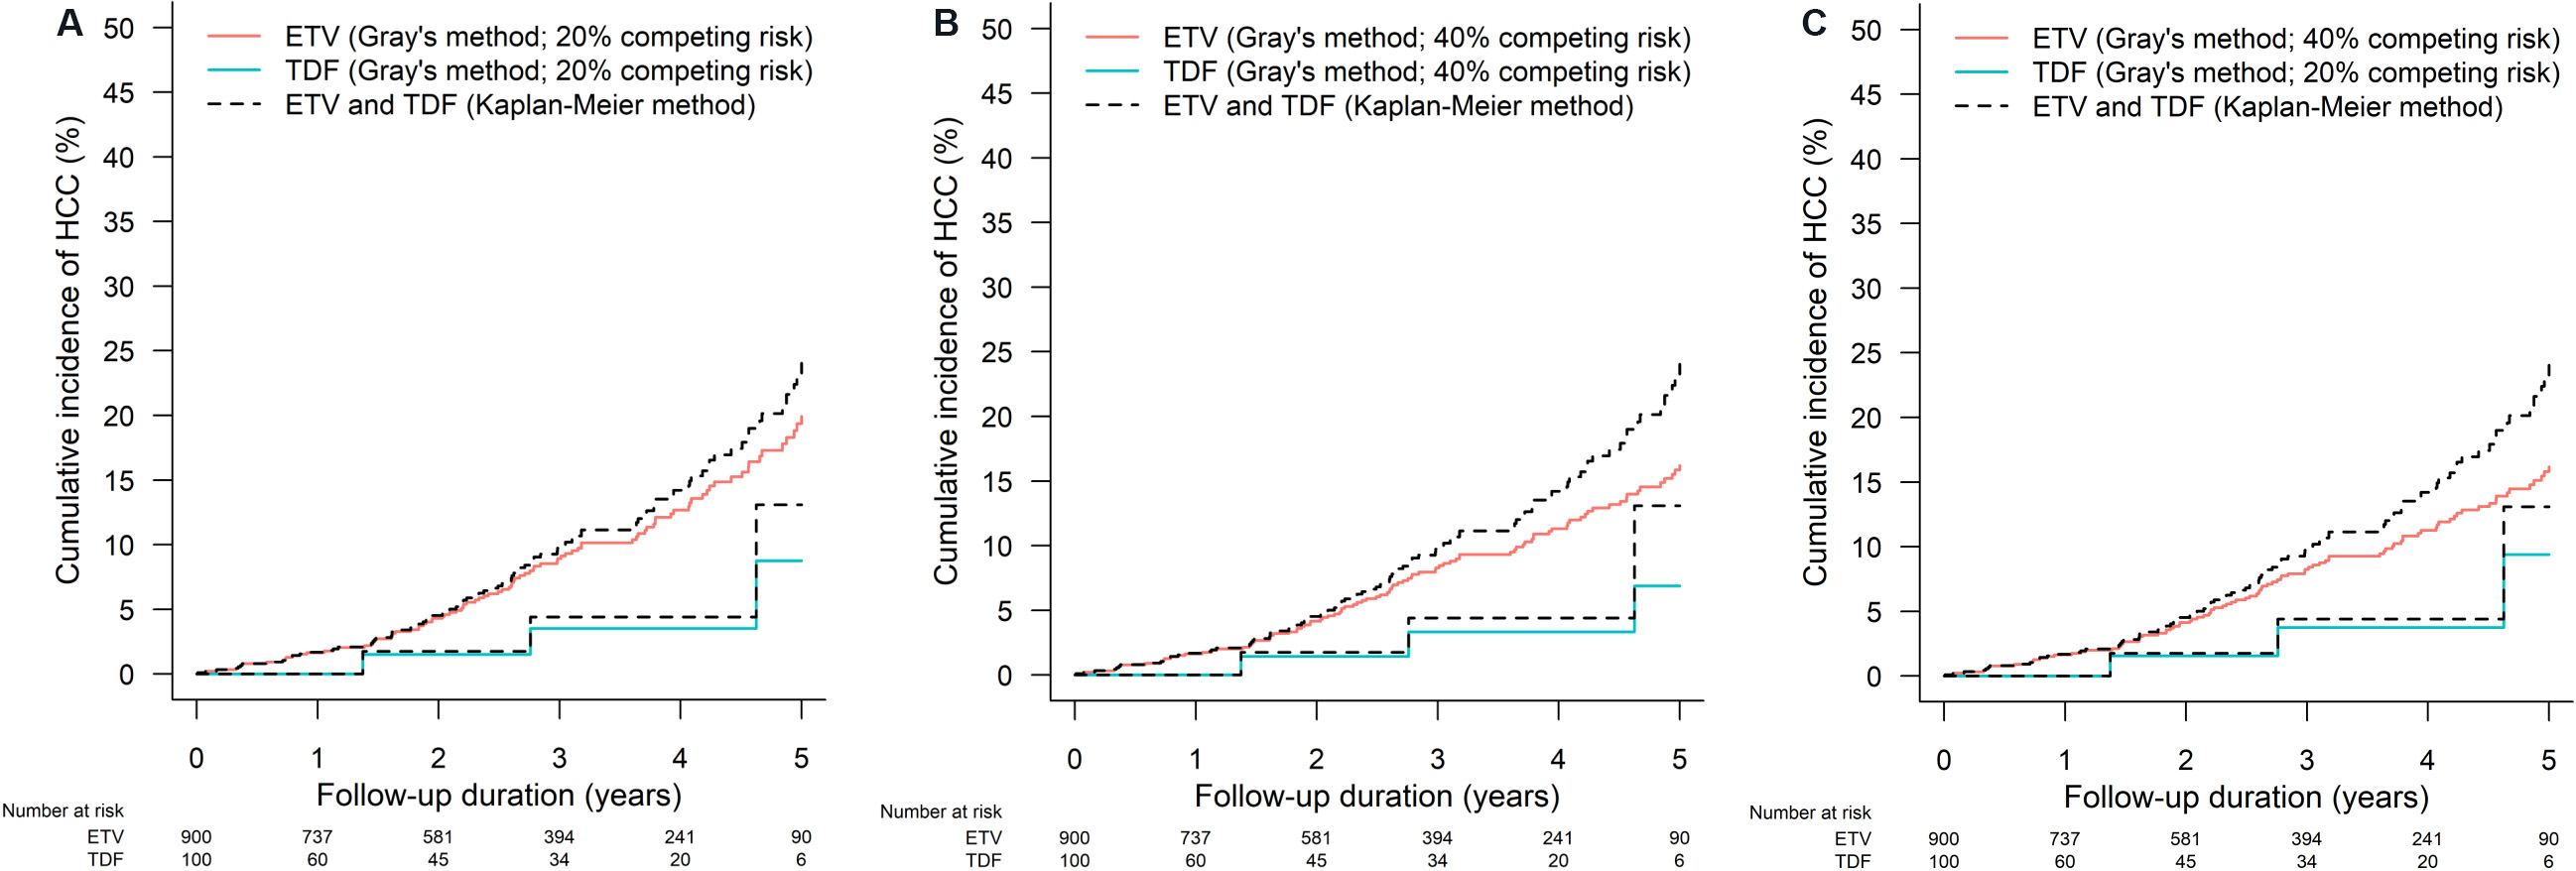
Figure 3. The effect of the presence of competing risk on the overestimation of cumulative incidence of hepatocellular carcinoma (HCC) by the Kaplan Meier method under (A) 20% of competing risk in all patients, (B) 40% competing risk in all patients, and (C) 20% and 40% of competing risk in 100 tenofovir disoproxil fumarate (TDF)- and 900 entecavir (ETV)-treated simulated patients respectively. Gray’s method that takes competing risk into account when estimating the cumulative incidence function is used as a reference.
Meta-analysis
Meta-analysis is a systematic way in evidence‐based medicine to generate a pooled effect estimate based on effect estimates and standard errors of individual studies extracted from the available literature or obtained directly from the study authors[38]. Between December 2019 and November 2021, 12 meta-analyses that compared ETV and TDF treatment on the risk of HCC in CHB patients were published [Table 2][39]. These meta-analyses included a median of 13 studies to provide a pooled estimate on the treatment difference between ETV and TDF on HCC prevention; most of the included studies were based on Asian populations. Most of the meta-analyses calculated the pooled hazard ratio using the hazard ratio after multivariable regression or PS matching in each of the included studies, while some used risk ratio as the summary estimate [Table 2]; risk ratio does not incorporate the time-to-event nature of HCC occurrence and can be affected by the difference in follow-up duration in the two treatment arms. As expected, most of the meta-analyses reported moderate to high heterogeneity between studies as reflected by the high I2 statistic, which indicates the percentage of the variability in effect estimates that is due to heterogeneity instead of sampling error. As shown in Table 1, studies had different strategies including multivariable regression and PS matching/weighting to tackle within-study heterogeneity of the ETV- and TDF-treated patients. Even if PS matching/weighting was used, studies included different covariates in the PS estimation due to the availability of data as well as the percentage of missing data. Together with the differences in inclusion and exclusion criteria as well as missing data management, all these features contributed to the between-study heterogeneity as shown in the meta-analyses. Consequently, the pooled estimates were obtained by a random-effects model in the meta-analyses. To tackle the problem of between-study heterogeneity, individual patient data meta-analysis is a possible approach by aggregating the data of individual patients in the studies instead of the effect estimate of the studies, though it involves a potentially long process of communication with study authors[40]. Choi et al.[39] summarized the methodological challenges in performing and interpreting the findings of these meta-analyses of observational studies.
List of meta-analyses between May 2019 and Nov 2021 that compared the effectiveness of entecavir (ETV) and tenofovir (TDF) in reducing the risk of HCC (adopted and modified from Choi et al.[39])
| Ref. | Included studies, n | Unadjusted HR (95%CI) P valuec | Adjusted HRd (95%CI) P valuec | I2 in unadjusted HR (%)e P valuec | I2 in adjusted HR (%)e P valuec |
| Zhang et al.[49] 2019a | 7 | N.A.a,b | N.A. | 0% P = 0.78 | N.A. |
| Li et al.[50] 2020 | 32 | 0.87 (0.73-1.04) P = 0.13 | N.A. | 59.0% P < 0.01 | N.A. |
| Wang et al.[51] 2020a | 13 | N.A.a | N.A. | 40.0% P = 0.11 | N.A. |
| Gu et al.[52] 2020 | 11 | 0.75 (0.65-0.87) P < 0.001 | 0.77 (0.60-0.99) P = 0.04 | 47.0% P = 0.07 | 40.0% P = 0.12 |
| Kamal et al.[53] 2020f | 7 | 0.84 (0.63-1.12) P = 0.240 | 0.94 (0.63-1.40) P = 0.750 | 43% | 49% |
| Liu et al.[54] 2020 | 7 | N.A. | 0.75 (0.56-0.96) N.A. | N.A. | 47.5% P = 0.076 |
| Teng et al.[55] 2020 | 10 | N.A.a | N.A.a | N.A. | N.A. |
| Cheung et al.[56] 2020 | 13 | N.A. | 0.81 (0.67-0.99) P = 0.041 | N.A. | 43.4% P = 0.066 |
| Kim et al.[57] 2020f | 7 | N.A. | 0.96 (0.74-1.25) P = 0.79 | N.A. | 50% P = 0.06 |
| Dave et al.[58] 2020 | 14 | N.A. | 0.79 (0.63-0.99) b P = 0.04 | N.A. | 58.0% N.A. |
| Tseng et al.[7] 2020 | 15 | 0.75 (0.54-1.03) 0.080 | 0.88 (0.73-1.07) P = 0.20 | 76.7% P < 0.0001 | 56.4% P = 0.0038 |
| Choi et al.[8] 2021 | 15 | 0.80 (0.69-0.93) P = 0.003 | 0.75 (0.58-0.97) P = 0.028 | 13.0% P = 0.31 | 46.0% P = 0.09 |
| Yuan et al.[59] 2021 | 13 | 0.75 (0.60-0.95) N.A. | 0.83 (0.66-1.03) N.A. | 80.9% P < 0.01 | 63.0% P = 0.003 |
| Jeong et al.[60] 2021 | 17 | N.A.a | N.A.a | 80% P < 0.01 | 64% P = 0.01 |
CONCLUSION
Since the publication by Choi et al.[4] in 2019, the potential difference in the risk of HCC in ETV- or TDF-treated CHB patients has remained controversial due to the contradictory findings from different studies and meta-analyses. The intrinsic limitations of observational studies, and the difference in study period, inclusion and exclusion criteria, and statistical strategies in the studies, have brought heterogeneity to meta-analyses and uncertainty to the conclusion. It is thus important to understand the data source and methodology used in each of these studies to make a more appropriate comparison and aggregation of findings. Ideally, a high-quality, multicenter randomized controlled trial will provide a high level of evidence to end the debate. Nonetheless, it is unlikely to happen due to the significant time and resources needed to follow the patients and the large sample size required. Future work should focus on well-designed observational studies with high-quality data sources to mitigate the biases. For meta-analysis, aggregation of raw data in the patients’ level with a standardized analysis protocol (i.e., an individual patient data meta-analysis) instead of pooling the individual effect estimates would reduce the between-study heterogeneity and yield a more accurate estimate of the treatment effect.
DECLARATIONS
Authors’ contributionsConcept and design of the article, interpretation of relevant literature, the drafting, and critical revision of the manuscript for important intellectual content: Yip TCF, Wong VWS, Lai MSM, Hui VWK, Tse YK, Wong GLH
Availability of data and materialsNot applicable.
Financial support and sponsorshipNot applicable.
Conflicts of interestYip TCF has served as an advisory committee member and a speaker for Gilead Sciences. Wong VWS has served as an advisory committee member for 3V-BIO, AbbVie, Allergan, Boehringer Ingelheim, Echosens, Gilead Sciences, Intercept, Janssen, Novartis, Novo Nordisk, Perspectum Diagnostics, Pfizer, TARGET-NASH, and Terns; and he has served as a speaker for Bristol-Myers Squibb, Echosens, Gilead Sciences and Merck. He has also received a research grant from Gilead Sciences. Wong GLH has served as an advisory committee member for Gilead Sciences and Janssen, as a speaker for Abbott, Abbvie, Bristol-Myers Squibb, Echosens, Furui, Gilead Sciences, Janssen and Roche, and received research grant from Gilead Sciences. Lai MSM, Hui VWK, and Tse YK declared that there are no conflicts of interest.
Ethical approval and consent to participateNot applicable.
Consent for publicationNot applicable.
Copyright© The Author(s) 2022.
REFERENCES
1. Sarin SK, Kumar M, Lau GK, et al. Asian-Pacific clinical practice guidelines on the management of hepatitis B: a 2015 update. Hepatol Int 2016;10:1-98.
2. Association for the Study of the Liver. Electronic address: easloffice@easloffice.eu., European Association for the Study of the Liver. EASL 2017 Clinical Practice Guidelines on the management of hepatitis B virus infection. J Hepatol 2017;67:370-98.
3. Terrault NA, Lok ASF, McMahon BJ, et al. Update on prevention, diagnosis, and treatment of chronic hepatitis B: AASLD 2018 hepatitis B guidance. Hepatology 2018;67:1560-99.
4. Choi J, Kim HJ, Lee J, Cho S, Ko MJ, Lim YS. Risk of hepatocellular carcinoma in patients treated with entecavir vs tenofovir for chronic hepatitis B: A Korean Nationwide Cohort Study. JAMA Oncol 2019;5:30-6.
5. Kim SU, Seo YS, Lee HA, et al. A multicenter study of entecavir vs. tenofovir on prognosis of treatment-naïve chronic hepatitis B in South Korea. J Hepatol 2019;71:456-64.
6. Yip TC, Wong VW, Chan HL, Tse YK, Lui GC, Wong GL. Tenofovir is associated with lower risk of hepatocellular carcinoma than entecavir in patients with chronic HBV infection in China. Gastroenterology 2020;158:215-225.e6.
7. Tseng C, Hsu Y, Chen T, et al. Hepatocellular carcinoma incidence with tenofovir versus entecavir in chronic hepatitis B: a systematic review and meta-analysis. Lancet Gastroenterol Hepatol 2020;5:1039-52.
8. Choi WM, Choi J, Lim YS. Effects of tenofovir vs entecavir on risk of hepatocellular carcinoma in patients with chronic HBV infection: a systematic review and meta-analysis. Clin Gastroenterol Hepatol 2021;19:246-258.e9.
9. Petri H, Urquhart J. Channeling bias in the interpretation of drug effects. Stat Med 1991;10:577-81.
10. Ankarfeldt MZ, Thorsted BL, Groenwold RH, Adalsteinsson E, Ali MS, Klungel OH. Assessment of channeling bias among initiators of glucose-lowering drugs: a UK cohort study. Clin Epidemiol 2017;9:19-30.
11. Papatheodoridis GV, Dalekos GN, Idilman R, et al. Similar risk of hepatocellular carcinoma during long-term entecavir or tenofovir therapy in Caucasian patients with chronic hepatitis B. J Hepatol 2020;73:1037-45.
12. Chen CH, Chen CY, Wang JH, Lai HC, Hung CH, Lu SN, Peng CY. Comparison of incidence of hepatocellular carcinoma between chronic hepatitis B patients with cirrhosis treated with entecavir or tenofovir in Taiwan - a retrospective study. Am J Cancer Res 2020;10:3882-95.
13. Su F, Berry K, Ioannou GN. No difference in hepatocellular carcinoma risk between chronic hepatitis B patients treated with entecavir versus tenofovir. Gut 2021;70:370-8.
14. S; ANRS/AFEF study group. Similar 5-year HCC occurrence in tenofovir- and entecavir-treated HBV chronic infection in the French AFEF/ANRS CO22 Hepather cohort. Aliment Pharmacol Ther 2021;53:616-29.
15. Chang TS, Yang YH, Chen WM, et al. Long-term risk of primary liver cancers in entecavir versus tenofovir treatment for chronic hepatitis B. Sci Rep 2021;11:1365.
16. Shim JH, Lee HC, Kim KM, et al. Efficacy of entecavir in treatment-naïve patients with hepatitis B virus-related decompensated cirrhosis. J Hepatol 2010;52:176-82.
17. Yip TC, Chan HL, Tse YK, et al. On-treatment improvement of MELD score reduces death and hepatic events in patients with hepatitis B-related cirrhosis. Am J Gastroenterol 2018;113:1629-38.
18. Yip TC, Lee HW, Wong VW, et al. Factors associated with improvement in MELD score after antiviral treatment in patients with chronic hepatitis B. J Gastroenterol Hepatol 2020;35:1610-8.
19. Kumada T, Toyoda H, Yasuda S, Miyake N, Ito T, Tanaka J. Long-term prognosis with or without nucleot(s)ide analogue therapy in hepatitis B virus-related decompensated cirrhosis. J Viral Hepat 2021;28:508-16.
20. Fu EL, Groenwold RHH, Zoccali C, Jager KJ, van Diepen M, Dekker FW. Merits and caveats of propensity scores to adjust for confounding. Nephrol Dial Transplant 2019;34:1629-35.
21. McCaffrey DF, Ridgeway G, Morral AR. Propensity score estimation with boosted regression for evaluating causal effects in observational studies. Psychol Methods 2004;9:403-25.
22. Westreich D, Lessler J, Funk MJ. Propensity score estimation: neural networks, support vector machines, decision trees (CART), and meta-classifiers as alternatives to logistic regression. J Clin Epidemiol 2010;63:826-33.
23. Güzelbulut F, Gökçen P, Can G, et al. Comparison of the efficacy of entecavir and tenofovir in reducing hepatocellular carcinoma risk in chronic hepatitis B patients: a real-life study in turkey. Turk J Gastroenterol 2021;32:412-21.
24. Austin PC. An introduction to propensity score methods for reducing the effects of confounding in observational studies. Multivariate Behav Res 2011;46:399-424.
25. Benedetto U, Head SJ, Angelini GD, Blackstone EH. Statistical primer: propensity score matching and its alternatives. Eur J Cardiothorac Surg 2018;53:1112-7.
26. Austin PC. Balance diagnostics for comparing the distribution of baseline covariates between treatment groups in propensity-score matched samples. Stat Med 2009;28:3083-107.
27. Cepeda MS, Boston R, Farrar JT, Strom BL. Comparison of logistic regression versus propensity score when the number of events is low and there are multiple confounders. Am J Epidemiol 2003;158:280-7.
28. Elze MC, Gregson J, Baber U, et al. Comparison of propensity score methods and covariate adjustment: evaluation in 4 cardiovascular studies. J Am Coll Cardiol 2017;69:345-57.
29. Lee KJ, Tilling KM, Cornish RP, et al. STRATOS initiative. Framework for the treatment and reporting of missing data in observational studies: The treatment and reporting of missing data in observational studies framework. J Clin Epidemiol 2021;134:79-88.
30. Sterne JA, White IR, Carlin JB, et al. Multiple imputation for missing data in epidemiological and clinical research: potential and pitfalls. BMJ 2009;338:b2393.
31. Rezvan P, Lee KJ, Simpson JA. The rise of multiple imputation: a review of the reporting and implementation of the method in medical research. BMC Med Res Methodol 2015;15:30.
32. Jakobsen JC, Gluud C, Wetterslev J, Winkel P. When and how should multiple imputation be used for handling missing data in randomised clinical trials - a practical guide with flowcharts. BMC Med Res Methodol 2017;17:162.
33. Little RJ, D’Agostino R, Cohen ML, et al. The prevention and treatment of missing data in clinical trials. N Engl J Med 2012;367:1355-60.
34. Choi H, Seo GH. Entecavir versus tenofovir for the prevention of hepatocellular carcinoma in treatment-naïve chronic hepatitis B patients in Korea. J Korean Med Sci 2021;36:e89.
35. Gooley TA, Leisenring W, Crowley J, Storer BE. Estimation of failure probabilities in the presence of competing risks: new representations of old estimators. Statist Med 1999;18:695-706.
36. Latouche A, Allignol A, Beyersmann J, Labopin M, Fine JP. A competing risks analysis should report results on all cause-specific hazards and cumulative incidence functions. J Clin Epidemiol 2013;66:648-53.
37. Austin PC, Fine JP. Practical recommendations for reporting Fine-Gray model analyses for competing risk data. Stat Med 2017;36:4391-400.
38. Burke DL, Ensor J, Riley RD. Meta-analysis using individual participant data: one-stage and two-stage approaches, and why they may differ. Stat Med 2017;36:855-75.
39. Choi WM, Yip TC, Lim YS, Wong GL, Kim WR. Methodological challenges of performing meta-analyses to compare the risk of hepatocellular carcinoma between chronic hepatitis B treatments. J Hepatol 2022;76:186-94.
40. Smith CT, Williamson PR, Marson AG. Investigating heterogeneity in an individual patient data meta-analysis of time to event outcomes. Stat Med 2005;24:1307-19.
41. Kim BG, Park NH, Lee SB, et al. Mortality, liver transplantation and hepatic complications in patients with treatment-naïve chronic hepatitis B treated with entecavir vs tenofovir. J Viral Hepat 2018;25:1565-75.
42. Hsu YC, Wong GL, Chen CH, et al. Tenofovir versus entecavir for hepatocellular carcinoma prevention in an international consortium of chronic hepatitis B. Am J Gastroenterol 2020;115:271-80.
43. Lee SW, Kwon JH, Lee HL, et al. Comparison of tenofovir and entecavir on the risk of hepatocellular carcinoma and mortality in treatment-naïve patients with chronic hepatitis B in Korea: a large-scale, propensity score analysis. Gut 2020;69:1301-8.
44. Ha I, Chung JW, Jang ES, Jeong SH, Kim JW. Comparison of the on-treatment risks for hepatocellular carcinoma between entecavir and tenofovir: A propensity score matching analysis. J Gastroenterol Hepatol 2020;35:1774-81.
45. Oh H, Yoon EL, Jun DW, et al. Long-Term Safety Of Entecavir And Tenofovir In Patients With Treatment-Naive Chronic Hepatitis B Virus (CHB) Infection (SAINT) Study. No difference in incidence of hepatocellular carcinoma in patients with chronic hepatitis B virus infection treated with entecavir vs tenofovir. Clin Gastroenterol Hepatol 2020;18:2793-802.e6.
46. Hu TH, Yueh-Hsia Chiu S, Tseng PL, et al. Five-year comparative risk of hepatocellular carcinoma development under entecavir or tenofovir treatment-naïve patients with chronic hepatitis B-related compensated cirrhosis in Taiwan. Aliment Pharmacol Ther 2020;52:1695-706.
47. Shin JW, Jeong J, Jung SW, et al. Comparable incidence of hepatocellular carcinoma in chronic hepatitis B patients treated with entecavir or tenofovir. Dig Dis Sci 2021;66:1739-50.
48. Na JE, Sinn DH, Lee JH, et al. Efficacy of entecavir versus tenofovir in preventing hepatocellular carcinoma in patients with chronic hepatitis B with maintained virologic response. J Viral Hepat 2021;28:1392-9.
49. Zhang Z, Zhou Y, Yang J, Hu K, Huang Y. The effectiveness of TDF versus ETV on incidence of HCC in CHB patients: a meta analysis. BMC Cancer 2019;19:511.
50. Li M, Lv T, Wu S, et al. Tenofovir versus entecavir in lowering the risk of hepatocellular carcinoma development in patients with chronic hepatitis B: a critical systematic review and meta-analysis. Hepatol Int 2020;14:105-14.
51. Wang X, Liu X, Dang Z, et al. Nucleos(t)ide analogues for reducing hepatocellular carcinoma in chronic hepatitis B patients: a systematic review and meta-analysis. Gut Liver 2020;14:232-47.
52. Gu L, Yao Q, Shen Z, et al. Comparison of tenofovir versus entecavir on reducing incidence of hepatocellular carcinoma in chronic hepatitis B patients: A systematic review and meta-analysis. J Gastroenterol Hepatol 2020;35:1467-76.
53. Kamal F, Khan MA, Marella HK, et al. 739 entecavir vs. tenofovir in prevention of hepatocellular carcinoma in patients with chronic hepatitis B: systematic review and meta-analysis. Gastroenterology 2020;158:S-1289.
54. Liu H, Shi Y, Hayden JC, Ryan PM, Rahmani J, Yu G. Tenofovir treatment has lower risk of hepatocellular carcinoma than entecavir treatment in patients with chronic hepatitis B: a systematic review and meta-analysis. Liver Cancer 2020;9:468-76.
55. Teng YX, Li MJ, Xiang BD, Zhong JH. Tenofovir may be superior to entecavir for preventing hepatocellular carcinoma and mortality in individuals chronically infected with HBV: a meta-analysis. Gut 2020;69:1900-2.
56. Cheung KS, Mak LY, Liu SH, et al. Entecavir vs tenofovir in hepatocellular carcinoma prevention in chronic hepatitis B infection: a systematic review and meta-analysis. Clin Transl Gastroenterol 2020;11:e00236.
57. Kim T, Yin HJ, Lee YS, et al. Comparison of the occurrence of hepatocellular carcinoma in patients of chronic hepatitis B with entecavir and tenofovir: a meta-analysis of Korean data. Hepatology 2020;72:479A.
58. Dave S, Park S, Murad MH, et al. Comparative effectiveness of entecavir versus tenofovir for preventing hepatocellular carcinoma in patients with chronic hepatitis B: a systematic review and meta-analysis. Hepatology 2021;73:68-78.
59. Yuan J, Peng Y, Hao FB, Wang YQ, Wang CR, Zhong GC. No difference in hepatocellular carcinoma risk in chronic hepatitis B patients treated with tenofovir vs entecavir: evidence from an updated meta-analysis. Aging (Albany NY) 2021;13:7147-65.
60. Jeong S, Cho Y, Park SM, Kim W. Differential effectiveness of tenofovir and entecavir for prophylaxis of hepatocellular carcinoma in chronic hepatitis B patients depending on coexisting cirrhosis and prior exposure to antiviral therapy: a systematic review and meta-analysis. J Clin Gastroenterol 2021;55:e77-86.
Cite This Article
Export citation file: BibTeX | RIS
OAE Style
Yip TF, Wong VS, Lai MM, Hui VK, Tse YK, Wong GH. Overview of methodologies and statistical strategies in observational studies and meta-analyses on the risk of hepatocellular carcinoma in patients with chronic hepatitis B on entecavir or tenofovir therapy. Hepatoma Res 2022;8:12. http://dx.doi.org/10.20517/2394-5079.2021.144
AMA Style
Yip TF, Wong VS, Lai MM, Hui VK, Tse YK, Wong GH. Overview of methodologies and statistical strategies in observational studies and meta-analyses on the risk of hepatocellular carcinoma in patients with chronic hepatitis B on entecavir or tenofovir therapy. Hepatoma Research. 2022; 8: 12. http://dx.doi.org/10.20517/2394-5079.2021.144
Chicago/Turabian Style
Yip, Terry Cheuk-Fung, Vincent Wai-Sun Wong, Mandy Sze-Man Lai, Vicki Wing-Ki Hui, Yee-Kit Tse, Grace Lai-Hung Wong. 2022. "Overview of methodologies and statistical strategies in observational studies and meta-analyses on the risk of hepatocellular carcinoma in patients with chronic hepatitis B on entecavir or tenofovir therapy" Hepatoma Research. 8: 12. http://dx.doi.org/10.20517/2394-5079.2021.144
ACS Style
Yip, T.F.; Wong V.S.; Lai M.M.; Hui V.K.; Tse Y.K.; Wong G.H. Overview of methodologies and statistical strategies in observational studies and meta-analyses on the risk of hepatocellular carcinoma in patients with chronic hepatitis B on entecavir or tenofovir therapy. Hepatoma. Res. 2022, 8, 12. http://dx.doi.org/10.20517/2394-5079.2021.144
About This Article
Copyright

Data & Comments
Data


 Cite This Article 9 clicks

 Like This Article 34
likes
Like This Article 34
likes


Comments
Comments must be written in English. Spam, offensive content, impersonation, and private information will not be permitted. If any comment is reported and identified as inappropriate content by OAE staff, the comment will be removed without notice. If you have any queries or need any help, please contact us at support@oaepublish.com.