
The transcontinental variability of nonalcoholic fatty liver disease
 0
0 , ...
, ... Abstract
Aim: To compare the phenotype of lean versus overweight (OW) and obese (OB) subjects with non-alcoholic fatty liver disease (NAFLD) across multiple continents.
Methods: A retrospective study of histologically defined subjects from a single center each in France (Fr), Brazil (Br), India (In) and United States (US) was performed.
Results: A total of 70 lean [body mass index (BMI) < 25 kg/m2] subjects (Fr:Br:In:US: 16:19:22:13) with NAFLD were compared to 136 OW (BMI > 25 kg/m2, BMI < 29 kg/m2) (n = 28:33:52:23) and 224 OB subjects (BMI > 29 kg/m2) (n = 81:11:22:103). Lean French subjects had the lowest incidence of type 2 diabetes while those from Brazil (P < 0.01) had the highest. Lean subjects had similar low-density lipoprotein-cholesterol, but higher high-density lipoprotein-cholesterol compared to obese subjects in all regions. In both lean and obese subjects, there were both insulin-sensitive and insulin-resistant subjects. Lean French subjects were most insulin-sensitive while those from Brazil were mostly insulin-resistant. For each weight category, subjects from India were more insulin-sensitive than those from other regions. Disease activity increased from lean to overweight to obese in France but was similar across weight categories in other regions.
Conclusion: The phenotype of NAFLD in lean subjects varies by region. Some obese subjects with NAFLD are insulin-sensitive. We hypothesize that genetics and region-specific disease modifiers account for these differences.
Keywords
Introduction
Non-alcoholic fatty liver disease (NAFLD) is a major cause of liver-related morbidity and mortality[1]. Nonalcoholic steatohepatitis (NASH), the more aggressive form of NAFLD, can progress to cirrhosis and end-stage liver disease more frequently than non-alcoholic fatty liver (NAFL)[2]. The principal risk factors for NAFLD include obesity and insulin resistance (IR) and its associated conditions such as type 2 diabetes[3-5].
Numerous reports from Asia and other parts of the developing world have identified NAFLD, including NASH, in lean subjects without biochemically obvious IR[6,7]. NAFLD has also been described in lean subjects in western countries[8-10]. There is however only limited information on the clinical, laboratory, and histological profile of lean versus obese subjects with NAFLD in the West. It is also not known if the histological spectrum of NAFLD and its relationship to IR is similar from one continent to another when subjects of identical body mass index (BMI) are considered. Similarly, when considering afflicted individuals with similar degree of IR, the distribution of histological findings from one continent to another is not known. These are likely to be relevant for either continuing a “one set of risk factors fits all” paradigm globally or informing development of “region-specific” risk stratification approaches.
In this study, we report data from four cohorts of subjects from the USA, Brazil, France and India to address the trans-continental drifts in disease phenotype across the spectrum of BMI and IR. The specific aims were to: (1) define the similarities and differences in disease expression between lean vs. obese subjects with NAFLD in the countries represented in this study; and (2) to compare the disease phenotype within specific weight and IR strata from one country to the next.
Methods
The current study is a retrospective cross-sectional analysis of a cohort of subjects with NAFLD at the participating centers. The participating centers were in Virginia, USA (PI: AJS), Brazil (PI: CPO), France (PI: LS) and India (PI: AC). The data sheets were developed at EUA: (2008-2013); France: (1999-2014); Brazil: (2009-2014); India (2008-2014); and analyzed by the investigators. The study involved an anonymized data set from an existing larger data set and was therefore considered exempt from IRB review.
Patient population
Subjects with biopsy proven NAFLD with a full set of histological and laboratory data were included in this analysis from each site. Exclusion criteria included age < 18 years, absence of full data set including measures of IR, liver injury and function, anthropometric data, lipid profile and liver histology. Subjects with concomitant presence of alternate causes of liver disease, e.g., hepatitis C were also excluded to avoid their confounding effects. Finally, those with drug-induced NAFLD, TPN-associated NAFLD, and bariatric surgery within last 5 years or known infectious, e.g., HIV or known genetic disorders, e.g., abetalipoproteinemia associated with NAFLD, were excluded to keep the analysis focused on “garden-variety” NAFLD.
Assessment of NAFLD
The liver histology was read by an experienced hepatopathologist at each site with multiple prior publications related to NAFLD. The presence of NAFLD was defined by the presence of hepatic steatosis (> 5%) confirmed by a liver biopsy in all instances; the nonalcoholic nature was established by clinical assessment of alcohol consumption to be less than 2 units daily for women and 3 units daily for men over the last 2 years[11]. Steatohepatitis was defined by the presence of steatosis (> 5%) along with lobular inflammation and cytological ballooning[11]. The severity of individual histological features of NAFLD was scored using the NIDDK NASH CRN criteria[12].
Assessment and stratification of body mass index
Lean, overweight and obese states were defined according to the World Health Organization and Modified National Cholesterol Education Program, Adult Treatment Panel III guidelines[13]. For subjects from India, two separate analyses were performed. In the first, the same body mass index cutoffs used in the West were used to define these states to directly relate the clinical-laboratory-histological findings across continents matched for BMI. A second analysis using the thresholds used for the Asian subcontinent was used in order to evaluate those who were lean versus obese using physiologically relevant parameters for the region[14,15].
Assessment and stratification of IR
IR was derived from fasting blood glucose and insulin. The Homeostatic Model of Assessment for IR (HOMA-IR) was calculated from the formula: [22.5 × fasting insulin (mU/mL) × glucose (mmol/L)][16].
To further visualize the relationship of glucose and insulin, the plasma insulin was plotted as a function of fasting plasma glucose. The resulting plot was divided in to four quadrants based on a fasting glucose threshold of 100 mg/dL and fasting insulin of 12 μU/mL. A fasting glucose below 100 mg/dL represents euglycemia and a fasting insulin level above 12 μU/mL has been associated with IR[17,18].
Subjects with a glucose < 100 mg/dL and a fasting insulin < 12 μU/mL were considered insulin sensitive. Those with a glucose < 100 mg/dL but insulin levels > 12 μU/mL were considered to have IR with relatively intact beta cell function. Those with higher plasma glucose (> 100 mg/dL) and insulin > 12 μU/mL were considered to have severe IR. When the fasting plasma glucose levels were higher than 100 mg/dL and the corresponding insulin levels declined below 12 μU/mL subjects were considered to have advanced IR with beta cell failure. Type 2 diabetes was defined by a fasting blood glucose > 126 mg/dL in patients who had a hemoglobin A1c level of 6.5% or greater, an FPG level of 126 mg/dL or greater[19].
Plan of analysis
Data were analyzed using SPSS version 2. Descriptive statistics of subjects from each site was performed. Data for lean versus overweight versus obese subjects were compared for each country individually. Numerical data were compared using analysis of variance for normally distributed data. Quantitative variables with asymmetric distribution were described as median and interquartile range and compared between groups using the Kruskal-Wallis test. Next, subjects within each BMI strata from each country were compared to other countries correcting for multiple comparisons using Tukey’s test. A similar analysis of overweight or obese subjects was also performed. In another analysis, the cohort was stratified by the HOMA scores of < 2, 2-4 and > 4 and a similar analysis performed. Finally, a multivariable regression analysis was performed to evaluate the interactions between BMI, IR and other clinical parameters on liver histology in lean subjects with NAFLD in each region. Significance was set at a P value of 0.05.
Results
A total of 430 subjects with biopsy-proven NAFLD was enrolled (USA:Brasil:France:India 139:125:96:63) [Table 1]. They included 70 lean (BMI < 25 kg/m2) subjects (Fr:Br:In:US 22:16:19:13), 136 overweight (Is this BMI > 25 kg/m2, BMI < 29 kg/m2) (n = 52:28:33:23) and 224 obese subjects (BMI > 29 kg/m2) (n = 22:81:11:103). Subjects in the Indian and French cohorts were younger (mean 38.06 ± 1.6; 49.7 ± 1.2, respectively) compared to those from US and Brazil (mean 53.3 ± 0.92; 55.08 ± 0.2, respectively). In France about 70% of the subjects were male while in Brazil and USA approximately 70% were female. In the Brazilian cohort the prevalence of type 2 diabetes mellitus (T2DM) and hypertension were globally higher than other countries.
Demographics and clinical profiles across-country in subjects with NAFLD
| Parameter | USA | France | Brazil | India |
|---|---|---|---|---|
| Age (years) | 53.3 ± 0.92 | 49.7 ± 1.2* | 55.08 ± 0.2 | 38.06 ± 1.6* |
| Females (%) | 71.2 | 30.9 | 46.5 | 66.2 |
| T2DM (%) | 21.1 | 21.6 | 53.3* | 31.0 |
| Hypertension (%) | 43.7 | 25.3 | 67.4* | 11.6 |
| Triglycerides (mg/dL) | 204.9 ± 10.3 | 112.5 ± 11.4* | 218.0 ± 7.9 | 198.3 ± 12.4 |
| Total Cholesterol (mg/dL) | 197.8 ± 4.2 | 206.5 ± 5.5 | 193.5 ± 4.2 | 165.8 ± 7.7 |
| LDL-XOL (mg/dL) | 125.8 ± 4.5 | 135.6 ± 7.1 | 115.5 ± 3.2 | 93.3 ± 6.6 |
| HDL-XOL (mg/dL) | 44.0 ± 5.4 | 43.0 ± 5.2 | 46.0 ± 5.5 | 40.0 ± 4.7 |
Comparison of lean vs. overweight and obese subjects
Demographic and clinical profiles
In the US cohort, obese subjects were younger than overweight and lean subjects, respectively (51.9 ± 1.0; 53.3 ± 2.1; 61.8 ± 1.9; P = 0.02) [Table 1]. While the proportion of subjects with hypertension or requiring lipid-lowering therapy were similar across the different weight strata, overweight subjects had less type 2 diabetes compared to lean and obese subjects (3.7% vs. 22.2% vs. 28.4%, P = 0.01). In the Brazilian cohort the prevalence of T2DM was high in lean subjects, approaching 66% [Figure 1]. In the French cohort, the proportion of individuals with features of the metabolic syndrome increased progressively from lean to overweight to the obese groups. The Indian cohort had more males in the lean group (P < 0.001 vs. other groups) and had a progressively greater proportion of subjects with T2DM with progressively higher weight strata.
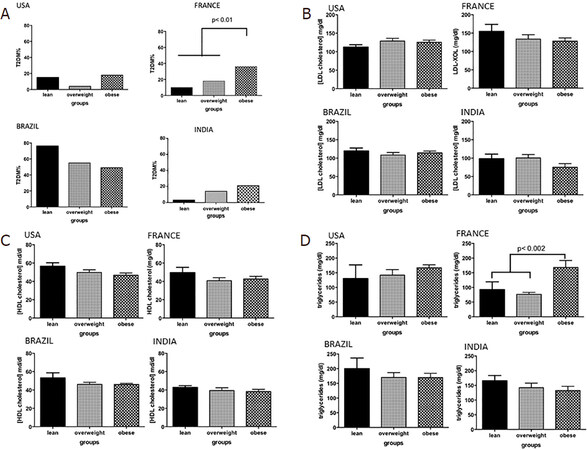
Figure 1. Comorbidities of lean vs.overweight vs. obese subjects with nonalcoholic fatty liver disease. A: type 2 diabetes mellitus (T2DM); B: LDL cholesterol; C: HDL cholesterol; D: triglycerides. LDL: low-density lipoprotein cholesterol; HDL: high-density lipoprotein cholesterol
Insulin resistance
The distribution of insulin and fasting glucose values yielded interesting insights in all regions [Figure 2]. In the US, approximately 20% of lean subjects had a fasting blood glucose < 100 mg/dL and a fasting insulin less than 12 mIU/mL. The remaining subjects had evidence of increasing IR with 4 subjects demonstrating IR with beta cell failure, i.e., low fasting insulin (< 12 mIU/mL) despite a fasting glucose > 100 mg/dL. As expected, obese subjects had a substantially greater number of insulin resistant subjects with and without beta cell dysfunction. Interestingly, 11 (11.45%) obese subjects had both low fasting glucose and insulin levels suggesting that they were relatively insulin sensitive.
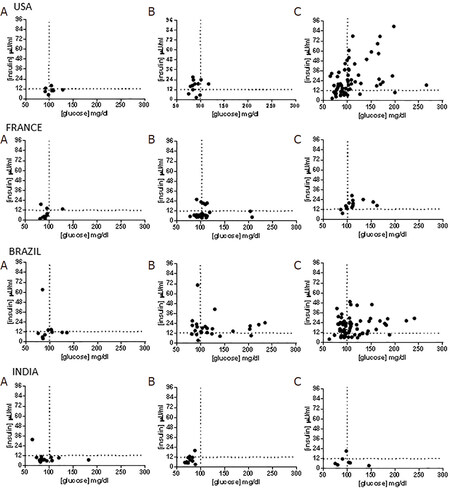
Figure 2. Insulin resistance and insulin sensitivity in nonalcoholic fatty liver disease lean subjects vs. overweight vs.obese across regions. A: lean subjects; B: overweight subjects; C: obese subjects
In the Brazilian cohort, 4 (25%) lean subjects had relatively low fasting insulin and glucose levels while the rest showed IR with or without beta cell failure [Figure 2]. As noted in the US cohort, a subset of subjects in the overweight and obese categories also were relatively insulin sensitive (fasting plasma glucose < 100 mg/dL, fasting plasma insulin < 12 µU/mL). In France, the majority of lean subjects were relatively insulin sensitive and IR increased progressively from lean-overweight-obese subjects and most overweight and obese subjects have more advanced IR. Subjects from India had lower fasting insulin levels compared to the other cohorts especially those from the US and Brazil even amongst obese subjects. Lean and obese subjects in the Indian cohort had similar insulin sensitivity.
Histology in lean versus obese subjects
The steatosis grade was similar across lean, overweight, and obese subjects in the US cohort [Figure 3]. Similarly, the inflammation, ballooning grades and fibrosis stage were similar across the weight strata. The spectrum of liver histology in subjects from Brazil was similar to that seen in the US. Importantly, the severity of steatosis, inflammation and ballooning were similar across the three weight strata in this country.
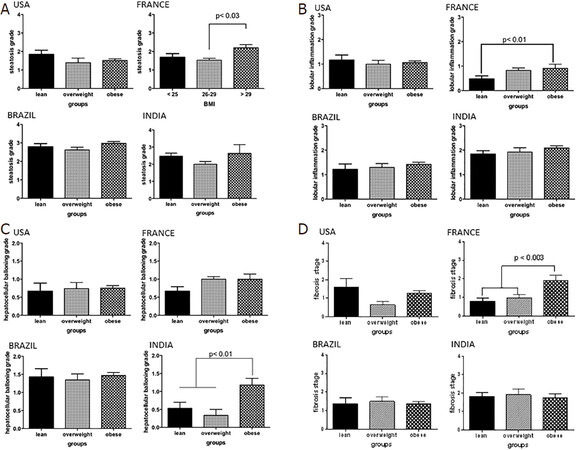
Figure 3. The histological spectrum of nonalcoholic fatty liver disease in lean vs.overweight vs.obese across regions. A: steatosis grade; B: lobular inflammation grade; C: hepatocellular ballooning; D: fibrosis stage
On the other hand, obese subjects in the French cohort had significantly greater steatosis grade compared to both lean and overweight subjects (P < 0.002). There was also a stepwise increase in inflammation grade from lean to overweight to obese subjects which reached significance (lean vs. obese P < 0.01). There was a trend for lower ballooning scores in the lean subjects (P = 0.06). Lean and overweight subjects also had a significantly lower fibrosis stage compared to the obese subjects (P < 0.01 for both).
Lean Indian subjects had similar degrees of steatosis compared to overweight and obese subjects. The lobular inflammation grades were also similar across the three weight groups. However, in contrast to other regions, the ballooning grade was significantly lower in lean and overweight subjects compared to obese subjects (P < 0.01 for both). The fibrosis stage was similar across the three weight categories. Recalibrating BMI threshold for Indians to 22 kg/m2 for the diagnosis of obesity did not alter the results qualitatively.
Clinical-laboratory-histological variability within similar weight strata
Lean subjects
Lean subjects in the US were also more likely to be hypertensive (55.6%) compared to those from Brazil (33.3%), France (14.3%), and India (15.8%). Only 9.5% of lean US subjects had T2DM compared to 26% of subjects in India and 66% of subjects in Brazil [Table 2]. There were no differences in the lipid profile of lean subjects across the various cohorts. However, subjects in Brazil were more insulin resistant than those in the other groups.
Comparison of lean subjects across study cohorts
| Parameter | USA | Brazil | France | India |
|---|---|---|---|---|
| Age (years) | 58.3 ± 0.7 | 57.7 ± 4 | 46 ± 6 | 40.5 ± 3 |
| Males (%) | 0 | 33.3 | 71.4 | 84.2 |
| Type 2 diabetes (%) | 22.2 | 55.6 | 9.5 | 26.3 |
| Hypertension (%) | 55.6 | 33.3 | 14.3 | 15.8 |
| Dyslipidemia (%) | 44.4 | 55.6 | 33.3 | 31.6 |
| AST (IU/L) | 50 (40-78) | 35 (20-93) | 29 (19-47) | 45 (24-60) |
| ALT (IU/L) | 49 (30-114) | 52 (22-101) | 60 (45-79) | 56 (31-84) |
| GGT (IU/L) | 170 (134-276) | 50 (25-286) | 75 (50-134) | 45 (36-72) |
| Triglycerides (mg/dL) | 83(83) | 129 (99-221) | 52 (22-100) | 132 (111-187) |
| HDL cholesterol (mg/dL) | 47(47) | 51 (38-66) | 44 (37-63) | 43 (35-49) |
| INR | 1 (0.9-1) | 1 (1-1) | 1.03 (1-1.10) | 1.2 (1.17-1.22) |
| Steatohepatitis (%) | 55.6 | 77.8 | 60 | 84 |
| Steatosis grade - 0/1/2/3 (%) | 0/33/44/23 | 0/22/55/22 | 0/55/20/25 | 10.5/36.8/47.4/5.3 |
| Lobular inflammation - 0/1/2/3 (%) | 12.5/62.5/12.5/12.5 | 33/22/33/12 | 50/40/10/0 | 26.3/63.2/10.5/0 |
| Ballooning - 0/1/2 (%) | 44.4/22.2/33.4 | 11/77/12 | 35/60/5 | 53/40/7 |
| Fibrosis stage - 0-none/1-perisinusoidal/2-portal-periportal/3-bridging/4-cirrhosis (%) | 11.1/33.3/0/33.3/22.2 | 0/44/44/12/0 | 21.4/50/14.3/14.3/0 | 57.9/15.8/15.8/10.5/0 |
| Glucose (mg/dL) | 95 (87-107) | 88 (85-126) | 90 (83-95) | 84 (80-95) |
| Insulin (mU/mL) | 10 (7-12) | 11 (6-15) | 5 (3-14) | 7 (6-10) |
| HOMA | 2.35 | 2.39 | 1.11 | 1.45 |
In line with greater IR, lean subjects from Brazil (mean grade 2.8) had a higher steatosis grade (P < 0.0005) compared to subjects from the US (mean grade 1.9), France (mean grade 1.8), and India (mean grade 2.2). Lean subjects from Brazil also had greater lobular inflammation (mean grade 1.5) compared to subjects from the other countries (mean grade range 0.5-0.7) (P < 0.0001). The ballooning grade was similar across the US, Brazilian, and Indian cohorts but was lower in lean subjects from the French cohort (P < 0.0001). Similarly, the mean fibrosis stage was similar across the US, Brazil, and India but higher than that seen in the French group (P < 0.0013).
Overweight subjects
The prevalence of hypertension and T2DM was higher in the subjects from Brazil. The mean HOMA scores were similar across the four groups. As noted in the lean subjects, a proportion of subjects were still relatively insulin sensitive whereas a proportion was insulin resistant with beta cell failure. Subjects from Brazil had more advanced IR with a majority of subjects with a fasting plasma glucose > 100 mg/dL. Interestingly, the ballooning grade was more severe in overweight subjects from India compared to those from the USA and France (1.7 vs. 1 vs. 0.8, P < 0.0001). Subjects from Brazil had intermediate degrees of ballooning injury (mean grade 1.2). The fibrosis stage in overweight subjects in the Indian cohort was modestly higher than the other cohorts (mean: 1.8 vs. 0.6 vs. 1 vs. 1.2 India vs. US vs. France vs. Brazil) [Table 3].
Comparison of overweight subjects across study cohorts
| Parameter | USA | Brazil | France | India |
|---|---|---|---|---|
| Age (years) | 54.1 ± 6 | 55.1 ± 2 | 51 ± 7 | 34.1 ± 5 |
| Males (%) | 30 | 48.6 | 70.2 | 46.2 |
| Type 2 diabetes (%) | 3.7 | 56.8 | 19.3 | 14.3 |
| Hypertension (%) | 30 | 45.9 | 23.6 | 0 |
| Dyslipidemia (%) | 44.4 | 73.0 | 21.4 | 30.8 |
| AST (IU/L) | 50 (39-84) | 30 (22-41) | 31 (23-48) | 40 (29-56) |
| ALT (IU/L) | 60 (46-95) | 36 (27-57) | 63 (48-80) | 45 (38-79) |
| GGT (IU/L) | 83 (38-156) | 66 (30-160) | 50 (27-103) | 46 (33-55) |
| Triglycerides (mg/dL) | 141 (76-195) | 150 (107-241) | 66 (40-108) | 120 (112-155) |
| HDL cholesterol (mg/dL) | 50 (40-61) | 48 (38-52) | 40 (30-52) | 37 (32-45) |
| INR | 1 (1-1) | 0.98 (0.95-1) | 1.08 (1.02-1.13) | 1.2 (1.14-1.27) |
| Steatohepatitis (%) | 60 | 73 | 80 | 70 |
| Steatosis grade - 0/1/2/3 (%) | 25/30/15/30 | 5.4/40.5/43.2/10.8 | 0/50/40/10 | 15.4/69.2/15.4/0 |
| Lobular inflammation - 0/1/2/3 (%) | 20.8/58.3/20.8/0 | 14.3/54.3/25.7/5.7 | 19.6/64.3/14.3/1.8 | 23.1/61.5/15.4/0 |
| Ballooning - 0/1/2 (%) | 45.8/37.5/16.7 | 60/40/10 | 12.5/71.5/16 | 67/33/0 |
| Fibrosis stage - 0-none/1-perisinusoidal/2-portal-periportal/3-bridging/4-cirrhosis (%) | 0/57.7/19.4/15.4/7.7 | 36.1/13.9/27.8/17.7/5.6 | 26.2/35.7/19.0/7.1/11.9 | 53.8/7.7/30.8/7.7/0 |
| Glucose (mg/dL) | 91 (83-102) | 110 (94-141) | 103 (94-113) | 78 (72-84) |
| Insulin (mU/mL) | 16 (10-19) | 16 (12-21.5) | 7 (5-16) | 7 (6-12) |
| HOMA | 3.6 | 4.35 | 1.78 | 1.35 |
Obese subjects
In Brazil almost 80% of the obese subjects were hypertensive while 49.5%, 44.4%, and 18.2% of obese subjects in US, France, and India respectively were hypertensive. 100% of the obese subjects in the Indian cohort had T2DM [Table 4]. The lipid profiles were comparable amongst obese subjects from different countries.
Comparison of obese subjects across study cohorts
| Parameter | USA | Brazil | France | India |
|---|---|---|---|---|
| Age (years) | 52.4 ± 2 | 55.1 ± 5 | 50.7 | 38.4 ±5 |
| Males (%) | 38 | 24.7 | 66.7 | 9.1 |
| Type 2 diabetes (%) | 28.4 | 51.9 | 44.4 | 100 |
| Hypertension (%) | 50 | 79.2 | 44.4 | 18.2 |
| Dyslipidemia (%) | 38 | 70.1 | 61.1 | 9.1 |
| AST (IU/L) | 40 (27-63) | 35 (20-93) | 48 (29-58) | 36 (23-62) |
| ALT (IU/L) | 53 (34-83) | 52 (22-101) | 76 (57-99) | 33 (29-78) |
| GGT (IU/L) | 38 (27-66) | 53 (27-87) | 55 (36-128) | 33 (28-46) |
| Triglycerides (mg/dL) | 149 (107-211) | 129 (99-221) | 141 (107-256) | 126 (99-155) |
| HDL cholesterol (mg/dL) | 43 (36-50) | 51 (38-66) | 43 (36-48) | 38 (32-42) |
| INR | 1 (0.97-1.0) | 1 (1.0-1.0) | 1.04(0.96-1.06) | 1.3 (1.2-1.3) |
| Steatohepatitis (%) | 56.8 | 89.6 | 81.3 | 90 |
| Steatosis grade - 0/1/2/3 (%) | 6.5/44.6/33.7/15.2 | 5.3/20.0/45.3/10.8 | 0/13/57/30 | 0/36.4/63.6/0 |
| Lobular inflammation - 0/1/2/3 (%) | 8.8/76.9/14.3/0 | 8/46.7/37.3/8 | 12.5/68.8/18.8/0 | 0/90/10/0 |
| Ballooning - 0/1/2 (%) | 38.6/45.5/15.9 | 46.6/52/1.3 | 12.5/68.8/18.8 | 9/63.6/27.4 |
| Fibrosis stage - 0-none/1-perisinusoidal/2-portal-periportal/3-bridging/4-cirrhosis (%) | 36.6/28.9/8.9/21.1/4.4 | 22.7/44/10.7/16/6.7 | 12.5/18.8/31.3/12.5/25.0 | 45.5/36.4/18.2/0/0 |
| Glucose (mg/dL) | 101 (86-124) | 103 (90-127) | 104 (96-143) | 93 (81-106) |
| Insulin (mU/mL) | 20 (14-37) | 17 (11-26) | 17 (14-20) | 7 (5-20) |
| HOMA | 4.99 | 4.32 | 4.37 | 1.65 |
As expected, most subjects had IR. Interestingly, a subset of obese subjects from each country had a fasting plasma glucose < 100 mg/dL as well as a fasting plasma insulin < 12 µU/mL indicating that they were relatively insulin sensitive. The proportion of such individuals was greatest in the cohort from India. The US cohort had somewhat lower steatosis grade whereas subjects from India had more inflammation and ballooning. The fibrosis stages were similar across the groups.
Transcontinental variability in histological severity in those with similar degrees of IR
A potential reason for the variability in histology from one country to another could be the variable degree of IR in each weight strata. In order to evaluate this, subjects were stratified into those with mild, moderate and severe IR (HOMA: 0-2, 2.1-4 and > 4 respectively). The severity of individual histological features was then assessed across the four study cohorts.
As expected, the severity of steatosis was largely similar across the four groups with the exception of somewhat lower steatosis in the Indian group in those with moderate IR (P < 0.01 vs. France). On the other hand, the group in Brazil had lower scores for lobular inflammation compared to other groups across multiple IR strata. They also had lower ballooning grades especially in those with moderate or severe IR. This was accompanied by less fibrosis across all strata of IR.
Discussion
Body weight and IR are two of the best-known risk factors for NAFLD. While it is known that many subjects with NAFLD in Asia are lean and do not have the usual biochemical features of IR, it was not known if a similar profile was also seen in lean subjects in other regions of the world. It is however generally believed that the relationship between body weight and severity of IR on one hand, versus liver histology is generally similar in all parts of the world. The current study challenges this “one size fits all” approach and demonstrates substantial differences and heterogeneity from countries in one continent versus even within similar weight strata.
The prevalence of obesity, T2DM and hypertension are higher in the USA and Brazil than in some European countries like France[20-23]. In Brazil, the prevalence of arterial hypertension found was 21.4% (95%CI: 20.8-22.0) using the self-reported criterion, 22.8% (95%CI: 22.1-23.4) for measured arterial hypertension, and 32.3% (95%CI: 31.7-33.0) for hypertension arterial pressure and / or report of medication use[24]. Furthermore, according IDF Atlas, in Brazil and USA, the prevalence of T2DM in 2019 was 8.5% and 11.1% respectively, while in Europe was 6.3%. USA is the third-highest country with patients with T2DM in the world, and Brazil the fifth[20]. Also, caloric consumption in American countries is higher than in some countries and in Europe[25]. In addition, patients in Brazil and the USA come from large tertiary-level university hospitals, where patients of greater severity are referred to them.
An important observation in this study is the remarkable range of laboratory-histological findings when comparing lean subjects with overweight and obese subjects in the different countries where this study was conducted. In France, a clear stepwise worsening of IR and severity of liver histology was noted with increasing BMI. In contrast, lean subjects in Brazil were more insulin-resistant and like overweight and obese subjects with respect to both the severity of their IR and liver histology. Subjects from the United States and India had an intermediate relationship with Indian subjects tending to demonstrate generally lower insulin levels than those from the other cohorts at all weight strata. These corroborate the concept that the severity of NAFLD is not a simple function of increasing body mass and that these relationships can be variable from one region to another.
The current study further demonstrates that the spectrum of IR and liver histology is variable from one country to another even when the body mass is accounted for. Lean subjects in the Brazilian cohort were more insulin-resistant and had greater steatosis than subjects from other regions. However, the severity of cytological ballooning was similar in the US, Brazil, and India and higher than that seen in the French subjects. These data are in line with the concept that development of liver injury is more than a simple function of IR and that additional factors are likely to play a role. While theoretically possible, we believe it is unlikely that these data purely represent differences in how the histology was read by the local pathologists since all of the pathologists involved are senior and experienced pathologists who have previously published in the field.
Another noteworthy finding in this study is that even in Western countries, a subset of overweight and even obese subjects with NAFLD were relatively insulin sensitive, i.e., with a fasting insulin < 12 µU/mL and [glucose] < 100 mg/dL. The lower blood glucose could not be attributed to the use of anti-diabetic therapy alone although it may have played a role in a few subjects. The only potential exception was the obese Indian cohort where all subjects were known to have diabetes and many also had a fasting plasma glucose < 100 mg/dL. While the presence of insulin sensitive obese individuals is well established[26], there is a general perception that these so called “fit-fat” subjects do not develop end organ diseases typically associated with IR. The current study further demonstrates that the distribution of liver histology in these subjects includes the full spectrum of NAFLD. The mechanisms underlying the liver disease in these subjects are not well understood. Unfortunately, due to the retrospective nature of this current analysis, the subjects were not genotyped and their PNPLA3 and TM6SF2 and other SNPs associated with the metabolic syndrome were not available. This is now a logical future direction of research in the field.
It is also not known if obese insulin-sensitive subjects respond to insulin sensitizers and improve their liver histology in the same manner as obese insulin resistant subjects. In the PIVENS trial, baseline HOMA scores did not predict histological response to pioglitazone[27,28]. This study however did not evaluate assess the insulin sensitivity status by HOMA alone but by graphical analysis of the relationship of glucose and insulin. It is also recognized that an euglycemic hyperinsulinemic clamp is the gold standard for measurement of insulin sensitivity[29]. In this retrospective analysis, this was not possible. However, it will be valuable to perform these in obese subjects with NAFLD who have a low fasting glucose and insulin level in the future to be certain that they are indeed insulin sensitive. Regardless, more information about the pathophysiological mechanisms underlying disease development and progression in obese or overweight insulin sensitive subjects will help future efforts to tailor specific therapies that are most likely to engage the relevant therapeutic targets in these individuals.
There is a difference in the aggressiveness of NAFLD between American and European countries, mainly Mediterranean countries. One interesting example is the number of liver transplantations in USA secondary NASH compared with Europe countries[30]. In Brazil there has also been an increase in the numbers of liver transplantations secondary to NASH. Several hypotheses can be considered for the greater severity of fibrosis in American countries, including lean NASH: (1) Higher caloric intake in the Americas, diet rich in fructose and trans lipids[31] low consumption of Mediterranean diet, including fiber and omega 3; (2) greater sedentary lifestyle in American countries; (3) presence of genetic factors such as PNPLA3[32]; and (4) dysbiosis, even in Lean NASH patients[33]. Furthermore, in the USA and Brazil, there is also admixture with genes from non-caucasian Hispanic and native American genes. American Hispanics have more severe NASH. The complex genetic background may be another potential explanation. Unfortunately given the sample size of this initial assessment, it is not feasible to address the role of genetics. Similarly, there may be differences in diet and also microbiome functionality that are not captured by current methods that could play a role. NASH is a complex disorder driven by gene environment interactions.
There were also differences in the spectrum of other end organ diseases within lean subjects with NAFLD. These corroborate the concept that the pathogenesis of each of these conditions is complex and there are regional variations in the prevalence rates and severity. All of these data further attest to the trans-continental drifts in phenotype development of this cluster of diseases.
There are several potential explanations for the observed variations in NAFLD phenotype and associated conditions across the four cohorts studied. These include genetic differences in susceptibility, regional variation in diet patterns, differences in the intestinal microbiome, exercise, environmental exposures etc. While a detailed analysis of these is beyond the scope of this manuscript, such studies are now indicated to better understand the variations in phenotype development in different regions.
Perhaps the most relevant implication of the current study is that it provides proof of concept that there are differences in both the histological phenotype and associated clinical features in subjects with NAFLD in different regions of the world and that region-specific data are now needed to provide optimal guidance for clinical care on various regions. Also, it raises the possibility that therapeutic responses in one region may or may not be similar from one region to another. A clearer understanding of variable disease mechanisms underlying the differences in phenotype development should help targeting therapeutics towards the most relevant targets in a given region and phenotype in the future.
The principal limitations of the current study are the relatively modest size of lean subjects with NAFLD in various regions and the potential for ascertainment bias. The small numbers of lean subjects however reflect the fact that they represent a small fraction of all subjects with NAFLD. Also, another limitation is that we report the prevalence of fibrosis stage in patients with NAFLD who had a biopsy at the centers in this study. Since this was done according to standard of care, the selection of patients for a biopsy was variable across centers. Further, the distribution of fibrosis could also be impacted by ascertainment bias due to the nature of the center. It was seen in the Indian cohort probably because increasing age is linked to higher stages if fibrosis and is generally considered to be due to longer exposure to disease state. It is potentially possible that the low fibrosis stage in India reflected the lower age of the population studied. It is noted in the section about variations across centers and as a potential explanation for the differences in fibrosis stage in India vs. other sites. However, most published studies of NAFLD also have the same ascertainment bias associated with tertiary care academic medical centers. These limitations notwithstanding, the current study demonstrates substantial variability in disease phenotype from one region to another.
In summary, the current study provides novel information on the variability in disease phenotype in lean as well as overweight and obese subjects in different parts of the world. It challenges the paradigm that all lean subjects with NAFLD have mild IR and have mild forms of liver disease. Conversely, it also demonstrates that a fraction of obese subjects with the full spectrum of NAFLD may be relatively insulin sensitive. Future studies to define the mechanistic basis for these differences may inform therapeutic choices in subjects in different regions.
Declarations
Authors’ contributionsDesign: Paredes A, Siddiqui M, Boyett S, Sanyal AJ
Performance: Oliveira CP, Paredes A, Siddiqui M, Serfaty L, Chowdhury A, Stefano JT, Vanni DS, Boyett S, Sanyal AJ
Analysis: Oliveira CP, Paredes A, Serfaty L, Chowdhury A, Sanyal AJ
Writing: Oliveira CP, Serfaty L, Chowdhury A, Stefano JT, Vanni DS, Sanyal AJ
Availability of data and materialsNot applicable.
Financial support and sponsorshipNone.
Conflicts of interestAll authors declared that there are no conflicts of interest.
Ethical approval and consent to participateThis was a retrospective study, approval from the study number 164.116 at the local Ethics Committee.
Consent for publicationNot applicable.
Copyright© The Author(s) 2020.
REFERENCES
1. Dulai PS, Singh S, Patel J, Soni M, Prokop LJ, et al. Increased risk of mortality by fibrosis stage in nonalcoholic fatty liver disease: systematic review and meta-analysis. Hepatology 2017;65:1557-65.
2. Wong RJ, Aguilar M, Cheung R, Perumpail RB, Harrison SA, et al. Nonalcoholic steatohepatitis is the second leading etiology of liver disease among adults awaiting liver transplantation in the United States. Gastroenterology 2015;148:547-55.
3. Leite NC, Salles GF, Araujo AL, Villela-Nogueira CA, Cardoso CR. Prevalence and associated factors of non-alcoholic fatty liver disease in patients with type-2 diabetes mellitus. Liver Int 2009;29:113-9.
4. Ercin CN, Dogru T, Genc H, Celebi G, Aslan F, et al. Insulin resistance but not visceral adiposity index is associated with liver fibrosis in nondiabetic subjects with nonalcoholic fatty liver disease. Metab Syndr Relat Disord 2015;13:319-25.
5. Dumas ME, Kinross J, Nicholson JK. Metabolic phenotyping and systems biology approaches to understanding metabolic syndrome and fatty liver disease. Gastroenterology 2014;146:46-62.
6. Feng RN, Du SS, Wang C, Li YC, Liu LY, et al. Lean-non-alcoholic fatty liver disease increases risk for metabolic disorders in a normal weight Chinese population. World J Gastroenterol 2014;20:17932-40.
7. Akyuz U, Yesil A, Yilmaz Y. Characterization of lean patients with nonalcoholic fatty liver disease: potential role of high hemoglobin levels. Scand J Gastroenterol 2015;50:341-6.
8. Younossi ZM, Stepanova M, Negro F, Hallaji S, Younossi Y, et al. Nonalcoholic fatty liver disease in lean individuals in the United States. Medicine (Baltimore) 2012;91:319-27.
9. Margariti E, Deutsch M, Manolakopoulos S, Papatheodoridis GV. Non-alcoholic fatty liver disease may develop in individuals with normal body mass index. Ann Gastroenterol 2012;25:45-51.
10. Das K, Chowdhury A. Lean NASH: distinctiveness and clinical implication. Hepatol Int 2013;7 Suppl 2:806-13.
11. Younossi ZM, Stepanova M, Rafiq N, Makhlouf H, Younoszai Z, et al. Pathologic criteria for nonalcoholic steatohepatitis: interprotocol agreement and ability to predict liver-related mortality. Hepatology 2011;53:1874-82.
12. Kleiner DE, Brunt EM, Van Natta M, Behling C, Contos MJ, et al. Design and validation of a histological scoring system for nonalcoholic fatty liver disease. Hepatology 2005;41:1313-21.
13. Expert panel on detection, evaluation, and treatment of high blood cholesterol in adults. Executive summary of the third report of the national cholesterol education program (NCEP) expert panel on detection, evaluation, and treatment of high blood cholesterol in adults (adult treatment panel III). JAMA 2001;285:2486-97.
14. Misra A. Revisions of cutoffs of body mass index to define overweight and obesity are needed for the Asian-ethnic groups. Int J Obes Relat Metab Disord 2003;27:1294-6.
15. Misra A, Chowbey P, Makkar BM, Vikram NK, Wasir JS, et al. Consensus statement for diagnosis of obesity, abdominal obesity and the metabolic syndrome for Asian Indians and recommendations for physical activity, medical and surgical management. J Assoc Physicians India 2009;57:163-70.
16. Ascaso JF, Pardo S, Real JT, Lorente RI, Priego A, et al. Diagnosing insulin resistance by simple quantitative methods in subjects with normal glucose metabolism. Diabetes Care 2003;26:3320-5.
17. Bugianesi E, Gastaldelli A, Vanni E, Gambino R, Cassader M, et al. Insulin resistance in non-diabetic patients with non-alcoholic fatty liver disease: sites and mechanisms. Diabetologia 2005;48:634-42.
18. Arata M, Nakajima J, Nishimata S, Nagata T, Kawashima H. Nonalcoholic steatohepatitis and insulin resistance in children. World J Diabetes 2014;5:917-23.
19. Menke A, Casagrande S, Geiss L, Cowie CC. Prevalence of and trends in diabetes among adults in the United States, 1988-2012. JAMA 2015;314:1021-9.
20. Cho NH, Shaw JE, Karuranga S, Huang Y, da Rocha Fernandes JD, et al. IDF diabetes atlas: global estimates of diabetes prevalence for 2017 and projections for 2045. Diabetes Res Clin Pract 2018;138:271-81.
21. Matta J, Carette C, Rives Lange C, Czernichow S. French and worldwide epidemiology of obesity. Presse Med 2018;47:434-8.
22. Martins-Silva T, Vaz JDS, Mola CL, Assunção MCF, Tovo-Rodrigues L. Prevalence of obesity in rural and urban areas in Brazil: national health survey, 2013. Rev Bras Epidemiol 2019;22:e190049.
23. Ng M, Fleming T, Robinson M, Thomson B, Graetz N, et al. Global, regional, and national prevalence of overweight and obesity in children and adults during 1980-2013: a systematic analysis for the Global Burden of Disease Study 2013. Lancet 2014;384:766-81.
24. Malta DC, Gonçalves RPF, Machado Í, Freitas MIF, Azeredo C, et al. Prevalence of arterial hypertension according to different diagnostic criteria, national health survey. Rev Bras Epidemiol 2018;21:e180021.
25. UN Food and Agricultural Organization FAOstat food balance sheets. Chapter 3: Calculation Of The Energy Content Of Foods - Energy Conversion Factors. Food and Agriculture Organization of the United Nations. Available from: http://www.fao.org/docrep/006/Y5022E/y5022e04.htm. [Last accessed on 24 Sep 2020].
26. Duncan GE. The “fit but fat” concept revisited: population-based estimates using NHANES. Int J Behav Nutr Phys Act 2010;7:47.
27. Pacana T, Sanyal AJ. Vitamin E and nonalcoholic fatty liver disease. Curr Opin Clin Nutr Metab Care 2012;15:641-8.
28. Sanyal AJ, Chalasani N, Kowdley KV, McCullough A, Diehl AM, et al. Pioglitazone, vitamin E, or placebo for nonalcoholic steatohepatitis. N Engl J Med 2010;362:1675-85.
29. Borai A, Livingstone C, Ferns GA. The biochemical assessment of insulin resistance. Ann Clin Biochem 2007;44:324-42.
30. Younossi ZM, Stepanova M, Ong J, Trimble G, AlQahtani S, et al. Nonalcoholic steatohepatitis is the most rapidly increasing indication for liver transplantation in the United States. Clin Gastroenterol Hepatol 2020; doi: 10.1016/j.cgh.2020.05.064.
31. Vilar L, Oliveira CP, Faintuch J, Mello ES, Nogueira MA, et al. High-fat diet: a trigger of non-alcoholic steatohepatitis? Preliminary findings in obese subjects. Nutrition 2008;24:1097-102.
32. Mazo DF, Malta FM, Stefano JT, Salles APM, Gomes-Gouvea MS, et al. Validation of PNPLA3 polymorphisms as risk factor for NAFLD and liver fibrosis in an admixed population. Ann Hepatol 2019;18:466-71.
Cite This Article
Export citation file: BibTeX | RIS
OAE Style
Oliveira CP, Paredes A, Siddiqui M, Serfaty L, Chowdhury A, Stefano JT, Vanni DS, Boyett S, Sanyal AJ. The transcontinental variability of nonalcoholic fatty liver disease. Hepatoma Res 2020;6:72. http://dx.doi.org/10.20517/2394-5079.2020.73
AMA Style
Oliveira CP, Paredes A, Siddiqui M, Serfaty L, Chowdhury A, Stefano JT, Vanni DS, Boyett S, Sanyal AJ. The transcontinental variability of nonalcoholic fatty liver disease. Hepatoma Research. 2020; 6: 72. http://dx.doi.org/10.20517/2394-5079.2020.73
Chicago/Turabian Style
Oliveira, Claudia P., Angelo Paredes, Mohammed Siddiqui, Lawrence Serfaty, Abhijit Chowdhury, Jose Tadeu Stefano, Denise Siqueira Vanni, Sherry Boyett, Arun J. Sanyal. 2020. "The transcontinental variability of nonalcoholic fatty liver disease" Hepatoma Research. 6: 72. http://dx.doi.org/10.20517/2394-5079.2020.73
ACS Style
Oliveira, CP.; Paredes A.; Siddiqui M.; Serfaty L.; Chowdhury A.; Stefano JT.; Vanni DS.; Boyett S.; Sanyal AJ. The transcontinental variability of nonalcoholic fatty liver disease. Hepatoma. Res. 2020, 6, 72. http://dx.doi.org/10.20517/2394-5079.2020.73
About This Article
Special Issue
Copyright

Data & Comments
Data
0

 Cite This Article 4 clicks

 Like This Article 39
likes
Like This Article 39
likes


Comments
Comments must be written in English. Spam, offensive content, impersonation, and private information will not be permitted. If any comment is reported and identified as inappropriate content by OAE staff, the comment will be removed without notice. If you have any queries or need any help, please contact us at support@oaepublish.com.