
Tumor growth rates and recurrence-free survival in chronic viral hepatitis patients with hepatocellular carcinoma
 0
0
Abstract
Aim: Survival in patients with hepatocellular carcinoma (HCC) is impacted by stage of liver disease, tumor characteristics, and HCC surveillance in high-risk individuals. Factors associated with HCC tumor growth rate (TGR) and its influence on recurrence-free survival after treatment was investigated.
Methods: TGR was calculated in 164 HCC patients with chronic viral hepatitis who had two consecutive magnetic resonance imaging or computed tomography scans ≥ 30 days apart prior to treatment and who were followed prospectively to determine the rates of recurrence-free survival.
Results: The median TGR in 164 patients was 17.8% per month (mean 33.3% per month). Regression tree analysis indicated that the top three predictors of TGR were alpha-fetoprotein (AFP) levels (≥ 16.7 ng/mL), platelet counts (≥ 140,000 mm3), and serum albumin level (< 3.55 g/dL). The regression tree identified patient groups with TGRs ranging from 0.65% to 39.4% per month. At a median follow-up of 22 months, the overall recurrence-free survival was 53.8%. The Cox model with backwards AIC search identified TGR (HR = 1.34, P = 0.029), age > 56 years (HR = 1.08, P = 0.072), hepatitis C virus (HR = 1.44, P = 0.091), macrovascular invasion (HR = 1.94, P = 0.092), and the most definitive treatments (orthotopic liver transplantation, HR 0.14, P < 0.001; surgical resection, HR = 0.54, P = 0.072; radiofrequency ablation, HR = 0.58, P = 0.060) as independent predictors of recurrence-free survival. For all treatment modalities, slow TGR was significant for prolonged survival (P = 0.029). The poorest survival rates were observed in patients with fast TGRs treated by transarterial chemoembolization.
Conclusion: The TGR correlated with AFP, platelet count, and albumin level. Patients with fast TGRs had shorter recurrence-free survival after HCC treatments. TGR is a potential imaging biomarker to predict clinical outcomes in HCC.
Keywords
Introduction
Worldwide, hepatocellular carcinoma (HCC) is the fifth most frequently encountered malignancy and is the third leading cause of cancer-related deaths[1]. In the United States, the incidence of HCC has significantly increased and is projected to be among the top three causes of cancer-related deaths by 2030[2]. In addition, the financial burden of HCC in the United States has continued to increase over the last decade[3]. Numerous studies showed that the most common etiologies are chronic infection with hepatitis B virus (HBV) and hepatitis C virus (HCV), with HBV accounting for at least 42% and HCV accounting for at least 27% of HCC cases globally[4]. The remaining cases are associated with excessive alcohol intake and non-alcoholic steatohepatitis.
Over the last two decades, improvements in HCC survival have been made by advances in HCC treatments in surgery and interventional radiology. Furthermore, the implementation of surveillance protocols in high-risk populations has resulted in early HCC detection and improved post-treatment survival[5]. Additional factors that predict HCC survival include the degree of liver dysfunction as well as the initial tumor size and number of tumors.
Another potential factor is the tumor volume doubling time (TVDT) which is assessed by two serial radiologic imaging studies prior to HCC treatments. Initially, TVDT was used to determine suitable screening intervals for early HCC detection. Previous imaging studies reported TVDTs ranging from a median of 117 days to a mean of 127 days, and suggested intervals of 4 to 5 months for HCC screening[6,7]. Other reports showed that shorter TVDTs were correlated with earlier deaths after hepatectomies as well as higher recurrence rates after surgical resection and radiofrequency ablation[8-10].
These papers on TVDT highlight its potential value as a prognostic tool for predicting HCC survival rates. Nevertheless, some of these studies were limited by early imaging technology, variations in screening intervals, and small sample sizes. Further, a recent report indicated that the TVDT is a less suitable variable for tumor growth rate because (1) mean TVDT estimates are not accurate if the time interval measurements are short; (2) the TVDT is not defined if the consecutively estimated volumes are similar; and (3) the asymmetrical frequency distribution of the TVDT makes it less suitable for statistical analysis[11]. In contrast, the mean tumor growth rate (TGR) gives a more correct value for average growth rate and has a symmetrical frequency distribution. Thus, an improved understanding of tumor growth, as measured by TGR, may help in guiding prognostic evaluations and aid in determining treatment options for patients with HCC. In the report herein, we assessed factors associated with TGR in 164 patients with chronic viral hepatitis and HCC. In addition, we evaluated the potential value of TGR as a factor in predicting recurrence-free survival after HCC treatment in these patients.
Methods
Patient population
Between 1984 and 2014, 357 patients with HCC were evaluated at the Liver Center in Pasadena, California. A database was created to collate and anonymize patient records, including laboratory tests, tumor size, HCC treatments, and current status. Amongst the 357 patients, 24 individuals were excluded from this study due to diffuse appearing tumor in which the size could not be determined (22 patients) or due to an HCC diagnosis made within six months of final patient entry into the database (2 patients). Of the remaining 333 patients, 169 who began HCC treatment prior to a second tumor size measurement were also excluded. The remaining 164 patients had two consecutive imaging studies prior to HCC treatment and are the subjects in the present study. HCC lesions were detected via surveillance in 113 patients with alpha-fetoprotein (AFP) testing and US scans. The remaining 51 patients were either diagnosed by their referring physicians or during their first visit to our Liver Center. The number and size of lesions, as reported by CT scan or MRI, were recorded. The diagnostic criteria for cirrhosis were by imaging findings of a nodular surface, platlet count < 140,000 mm3, presence of esophageal varices or ascites, or by liver biopsy.
The TGR was determined for all 164 patients. The diagnosis of HCC by MRI or CT scan were according to AASLD criteria from their 2005 and 2011 recommendations[12,13]. Prior to that time period, imaging criterion for HCC diagnosis relied on findings of a hypervascular lesion, elevated levels of AFP, tumor growth on subsequent imagin, and biopsy of the lesion if the above criteria were not clear. The dates and corresponding tumors sizes from the first and second imaging studies (CT or MRI) were recorded. The time interval between the first and second images were ≥ 30 days (median time 92 days), and all were prior to any treatments for HCC[5].
Baseline laboratory tests
Baseline laboratory tests were obtained from all patients. These included platelet counts, serum albumin, total bilirubin, alkaline phosphatase, aspartate aminotransferase, alanine aminotransferase, and AFP. For HBV patients, virus genotype, HBV DNA levels, precore mutation, basal core promoter mutation, and HBeAg were recorded. For HCV patients, virus genotype and HCV RNA levels were recorded. Sera from patients whose HCC was diagnosed prior to 1991 were retrospectively tested for anti-HCV antibodies and HCV RNA.
HCC treatments
Of the 164 patients followed in this study, 113 received definitive treatments, 7 received chemotherapy, and 44 were offered supportive care. HCC patients were referred to academic centers for surgical and/or locoregional therapies. Treatment options included orthotopic liver transplantation (OLT), surgical resection, RFA, transcatheter arterial chemoembolization (TACE), or percutaneous ethanol injection (PEI). If a patient had multiple treatments, they were assigned to the most definitive treatment category. OLT, surgical resection, and RFA were considered to be the most definitive treatments. Patients who did not receive one of the above treatments were given chemotherapy or supportive care.
Post-treatment outcomes
Patients who returned for regular follow-up care were continuously screened with imaging studies and laboratory tests. In order to calculate dates of recurrence-free survival, dates of diagnosis, initial treatment, recurrence, and latest follow-up or death were recorded.
Statistical analyses
Tumor growth rate calculation
The TGR was calculated using Schwartz’s equation: TGR = log(V/V0)/(T - T0) where T - T0 indicates the time interval between the two measurements and V0 and V represent the tumor volumes (V = 4/3pR2) at the two measurement points[14]. The Schwartz equation assumes early, exponential stage growth with the TGR reported in % per month. In the analyses below, log10 TGR is used since log TGR has a distribution closer to the normal distribution.
Predictors of tumor growth rate
Bivariate analysis - The bivariate analysis for assessing each categorical predictor vs. log TGR was computed using t-tests/analysis of variance. The correlation between log10 TGR and continuous variables was computed via the Spearman correlation (rs).
Multivariate analysis - The multivariable regression tree (binary partition) analysis was used to determine the simultaneous association between log10 TGR and 19 potential predictors, including age, gender, ethnicity, HCC surveillance, serum albumin, serum AFP, platelet count, cirrhosis, diabetes, initial tumor size, HBV or HCV infection, and antiviral treatment. For hepatitis B patients, HBV genotype, HBV DNA, precore mutation, basal core promoter mutation, and HBeAg values were included. For hepatitis C patients, HCV RNA and genotype were included. In this tree model, every value of each predictor variable was considered. Patients with slow vs. fast TGRs were separated via a progression of binary splits (partitions). The best split was determined by the impurity criterion, a reduction of the residual sum of squares due to the binary split (GINI criterion). Missing values were allowed. Each split resulted in one parent node and two child nodes. Child nodes, in turn, were split until further splits did not significantly improve the predicted TGR. The final result was an intuitive and interpretable decision tree[15]. A P < 0.07 was considered statistically significant.
Predictors of recurrence-free survival
Predictors of HCC recurrence-free survival were analysed. The outcome (event) was HCC recurrence or death. The primary predictor was log10 TGR. The other 9 potential predictors were age, gender, ethnicity, HCV or HBV, diabetes, cirrhosis, macrovascular invasion, HCC surveillance, and the most definitive treatments (OLT, surgical resection, RFA, PEI, TACE, chemotherapy, or supportive) for a total of 10 potential predictors. There were 125 events, 39 HCC recurrences and 85 deaths with no recurrence.
Bivariate analysis - Hazard ratios (HR) for each potential predictor, ignoring the other 9 predictors, were computed along with its 95% confidence bounds and P-values. Restricted cubic splines were used to determine if the relation between a continuous predictor vs. the log hazard ratio was linear.
Multivariate analysis - The 10 potential predictors simultaneous to the event rate were assessed using a Cox proportional hazard model. A backwards minimal AIC search was used to determine which of the potential predictors were significant, with the restriction that log10 TGR was included in all models. For the final model, all possible two-way interactions were evaluated. Statistical significance was taken as P < 0.07. Model accuracy was assessed using Harrell’s C concordance statistic with values of C ranging from 0.50 (worse) to 1.0 (best).
Results
The baseline characteristics of 164 HCC patients who had two consecutive imaging studies with either MRI or CT scans prior to treatments are listed in Table 1. The average age was 64.48 ± 10.38 years, 64.6% were male, and the majority were Asian (64.0%), followed by white (18.3%), Hispanic (14.0%), and African American (3.70%). Hepatitis B infection was detected in 39.6% of patients, Hepatitis C infection in 59.8%, and the remaining patients were co-infected with both viruses. In the HBV infected HCC patients with measurable tests, 21.5% were HBeAg positive, 29.2% were genotype C, 30.8% had basal core promoter mutations, 23.1% had precore mutations, and the mean HBV DNA level was 2.41 × 10⁶ IU/mL (IQR: 1.00-1.23 × 10⁵). In the HCV infected HCC patients with measurable tests, 45.9% had genotype 1 and the mean HCV RNA was 1.44 × 10⁶ IU/mL (IQR: 594.5-1.27 × 10⁶). The mean albumin level was 3.80 ± 0.66 g/dL, platelet count was 138,000 ± 75,600 mm3, and AFP level was 45.2 ± 11.8 ng/mL. Of 164 HCC patients, 68.9% were detected by surveillance. 19.5% had diabetes, 78.7% had cirrhosis, and 5.50% had macrovascular invasion.
Baseline characteristics of 164 patients with hepatocellular carcinoma
| Characteristic | Number (%) or Mean ± SD |
|---|---|
| Age at diagnosis (years) | 64.48 ± 10.38 |
| Gender | |
| Female | 58 (35.4) |
| Male | 106 (64.6) |
| Ethnicity | |
| African American | 6 (3.70) |
| Asian | 105 (64.0) |
| Hispanic | 23 (14.0) |
| White | 30 (18.3) |
| Virology | |
| HBV | 65 (39.6) |
| HCV | 98 (59.8) |
| HBV + HCV | 1 (0.60) |
| HBV genotype | |
| A | 3 (4.62) |
| B | 10 (15.4) |
| C | 19 (29.2) |
| F | 1 (1.54) |
| Missing | 32 (49.2) |
| HBV precore mutation | |
| Yes | 15 (23.1) |
| No | 18 (27.7) |
| Missing | 32 (49.2) |
| HBV basal core promoter mutation | |
| Yes | 20 (30.8) |
| No | 8 (12.3) |
| Missing | 37 (56.9) |
| HBeAg | |
| Negative | 42 (64.6) |
| Positive | 14 (21.5) |
| Missing | 9 (13.8) |
| HBV DNA (IU/mL)* | 2,411,000 (IQR: 1.00-123,400) |
| HCV genotype | |
| 1 | 45 (45.9) |
| 2 | 17 (17.3) |
| 3 | 6 (6.12) |
| 6 or 7 | 7 (7.14) |
| Mixed | 2 (2.04) |
| Missing | 21 (21.4) |
| HCV RNA (IU/mL)* | 1,442,000 (IQR: 594.5-1,270,000) |
| Antiviral treatment | |
| Yes | 50 (30.5) |
| No | 108 (65.9) |
| Missing | 6 (3.60) |
| Albumin (g/dL) | 3.80 ± 0.66 |
| Total bilirubin (mg/dL) | 1.30 ± 1.20 |
| Alkaline phosphate (U/L) | 128 ± 129 |
| AST (U/L) | 78.2 ± 59.2 |
| ALT (U/L) | 70.1 ± 54.3 |
| Platelet count (× 103 mm3) | 138 ± 75.6 |
| AFP (ng/mL) | 45.2 ± 11.8 |
| Surveillance | |
| Yes | 113 (68.9) |
| No | 51 (31.1) |
| Diabetes | |
| Yes | 32 (19.5) |
| No | 125 (76.2) |
| Missing | 7 (4.27) |
| Cirrhosis | |
| Yes | 129 (78.7) |
| No | 35 (21.3) |
| Macrovascular invasion | |
| Yes | 9 (5.50) |
| No | 149 (90.9) |
| Missing | 6 (3.60) |
| Initial tumor size (cm) | 3.62 ± 2.27 |
The tumor growth rate
The mean initial tumor size was 3.62 ± 2.27 cm. The TGR in 164 HCC patients ranged from 0% per month to 440.2% per month with a median growth rate of 17.8% per month and a mean growth rate of 33.3% per month. Bivariate predictors of log TGR are shown in Table 2. HCC patients with serum albumin levels ≤ 3.50 g/dL had a median TGR of 27.0% per month while those with albumin levels of > 3.50 g/dL had a median growth rate of 14.2% per month (P = 0.016). HCC patients with AFP levels ≤ 10.0 ng/mL had slower average growth rates compared to patients with AFP levels of 11.0-191 ng/mL and > 191 ng/mL (11.1%, 18.7%, and 30.3% respectively, P = 0.029). Also, HCC patients with diabetes had slower growth rates compared to those without diabetes (10.5% and 21.6% respectively, P = 0.051).
Bivariate predictors of tumor growth rate
| n | Median TGR (%/mo) | Q1-Q3 (%/mo) | P-value | |
|---|---|---|---|---|
| Gender | ||||
| Female | 58 | 15.6 | 4.60-35.9 | 0.6560 |
| Male | 106 | 19.3 | 4.90-40.4 | |
| Ethnicity | ||||
| African American | 6 | 9.10 | 0.70-19.3 | 0.2526 |
| Asian | 105 | 18.0 | 5.40-38.4 | |
| Hispanic | 23 | 11.8 | 2.40-34.4 | |
| White | 30 | 26.3 | 6.00-47.9 | |
| Virology | ||||
| HBV | 65 | 23.2 | 5.40-42.4 | 0.3284 |
| HCV | 98 | 16.6 | 4.10-33.4 | |
| HBV + HCV | 1 | 2.20 | -- | |
| HBV genotype | ||||
| A | 3 | 33.0 | 4.60-59.6 | 0.5253 |
| B | 10 | 17.9 | 3.30-38.5 | |
| C | 19 | 21.8 | 9.60-51.7 | |
| F | 1 | -- | -- | |
| HBV precore mutation | ||||
| Yes | 15 | 28.7 | 8.10-54.0 | 0.4053 |
| No | 18 | 22.5 | 11.3-76.8 | |
| HBV basal core promoter mutation | ||||
| Yes | 20 | 22.5 | 10.3-50.4 | 0.7229 |
| No | 8 | 17.8 | 6.30-41.1 | |
| HBeAg | ||||
| Negative | 42 | 20.5 | 4.90-37.8 | 0.3877 |
| Positive | 14 | 30.8 | 7.70-68.5 | |
| HBV DNA | ||||
| Negative | 3 | 42.4 | 5.30-64.9 | 0.7686 |
| Positive | 54 | 21.1 | 5.20-35.6 | |
| HCV genotype | ||||
| 1 | 45 | 12.9 | 2.30-28.1 | 0.1408 |
| 2 | 17 | 22.0 | 9.20-42.3 | |
| 3 | 6 | 29.3 | 23.5-44.3 | |
| 6/7/mixed | 9 | 3.00 | 2.20-32.5 | |
| HCV RNA | ||||
| Negative | 15 | 14.4 | 4.70-26.2 | 0.3802 |
| Positive | 61 | 15.2 | 3.10-28.5 | |
| Antiviral treatment | ||||
| Yes | 50 | 18.6 | 2.30-37.8 | 0.8826 |
| No | 108 | 17.8 | 7.10-36.8 | |
| Albumin (g/dL) | ||||
| ≤ 3.50 | 55 | 27.0 | 8.00-46.3 | 0.0161 |
| > 3.50 | 109 | 14.2 | 2.60-32.5 | |
| AFP (ng/mL) | ||||
| ≤ 10.0 | 54 | 11.1 | 2.50-28.3 | 0.0294 |
| 10.0-191 | 66 | 18.7 | 7.40-34.8 | |
| > 191 | 40 | 30.3 | 4.20-75.2 | |
| Platelet count (× 103 mm3) | ||||
| ≤ 75.0 | 34 | 23.7 | 7.70-39.5 | 0.2834 |
| 75.0-150 | 62 | 15.4 | 2.50-31.7 | |
| > 150 | 64 | 20.4 | 7.10-41.8 | |
| Surveillance | ||||
| Yes | 113 | 18.0 | 4.30-38.4 | 0.5565 |
| No | 51 | 15.2 | 5.00-37.6 | |
| Diabetes | ||||
| Yes | 32 | 10.5 | 2.00-28.1 | 0.0506 |
| No | 125 | 21.6 | 5.60-42.3 | |
| Cirrhosis | ||||
| Yes | 129 | 17.7 | 4.10-38.4 | 0.5418 |
| No | 35 | 17.9 | 8.10-36.9 | |
Of the 19 variables evaluated, the regression tree model identified AFP < or > 16.7 ng/mL as the best single discriminator between slow and fast growing tumors expressed in log TGR. The next best predictor of TGR in the high AFP node was platelet counts < or > 140,000 mm3. For the node with patients having an AFP ≥ 16.7 ng/mL and a platelet count < 140,000 mm3, an albumin level < or > 3.55 g/dL provided additional prognostic value. Further analysis identified age at < or > 56 years and ethnicity as other significant variables. As shown in Figure 1, an AFP value of < or > 16.7 ng/mL best discriminated slow and fast-growing tumors (10.9% per month and 23.8% per month respectively, P = 0.050). Within the AFP ≥ 16.7 ng/mL node, platelet counts of < or > than 140,000 mm3 next discriminated TGRs of 21.0% per month and 39.4% per month respectively (P = 0.085). In the platelet count < 140,000 mm3 node, albumin level ≥ 3.55 g/dL identified the slower growing tumors with a TGR of 9.15% per month, while those with albumin level < 3.55 g/dL had a TGR of 31.4% per month (P = 0.0004). Within the albumin level < 3.55 g/dL node, ethnicity other than Hispanic had a faster TGR (36.4% per month vs. 11.4% per month, P = 0.005). Finally, within the albumin ≥ 3.55 g/dL node, age < or > than 56 years had TGRs of 0.65% per month and 15.7% per month respectively.
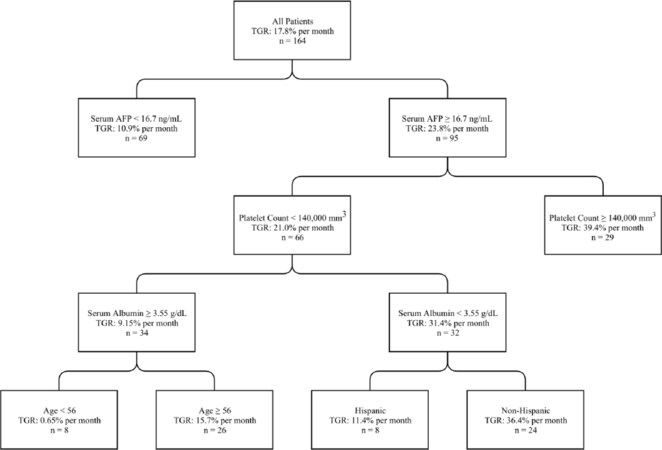
Figure 1. Regression tree analysis: predictors of hepatocellular carcinoma tumor growth rates. Each node is based on available data for each predictive variable presented. TGR is reported as a median. TGR: tumor growth rate; AFP: alpha-fetoprotein
The survival outcomes
The overall recurrence-free survival for 164 HCC patients is shown in Figure 2. At a median time of 22 months, 53.8% of the HCC patients were alive and recurrence-free. A bivariate analysis which included 10 potential predictors showed that the TGR (HR = 1.27, P = 0.061), age (HR = 1.02, P = 0.006), HCV (HR = 1.42, P = 0.061), surveillance (HR = 0.70, P = 0.065), and the most definitive treatments (OLT, HR = 0.13, P < 0.0001; surgical resection, HR = 0.40, P = 0.004; RFA, HR = 0.50, P = 0.010) were significant predictors of tumor free survival [Table 3].
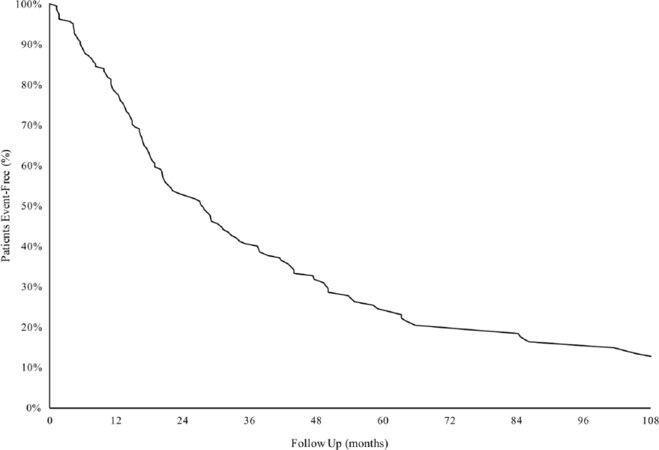
Figure 2. Recurrence-free survival of 164 patients with hepatocellular carcinoma
Bivariate and multivariate analysis of recurrence-free survival
| Bivariate analysis | Multivariate analysis | |||||||
|---|---|---|---|---|---|---|---|---|
| n | HR | 95%CI | P-value | HR | 95%CI | P-value | ||
| TGR (%/mo) | 164 | 1.27 | 0.99-1.63 | 0.0612 | TGR (%/mo) | 1.34 | 1.03-1.74 | 0.0289 |
| Age (years) | 164 | 1.02 | 1.01-1.04 | 0.0059 | Age (years) | 1.08 | 0.99-1.18 | 0.0717 |
| Hepatitis virus | Hepatitis virus | |||||||
| HBV | 65 | ref | HBV | ref | ||||
| HCV | 98 | 1.42 | 0.98-2.06 | 0.0606 | HCV | 1.44 | 0.94-2.20 | 0.0905 |
| HBV + HCV | 1 | -- | -- | HBV + HCV | ||||
| Sex | ||||||||
| Female | 58 | ref | ||||||
| Male | 106 | 0.87 | 0.60-1.25 | 0.449 | ||||
| Ethnicity | ||||||||
| African American | 6 | ref | ||||||
| Asian | 105 | 1.57 | 0.50-4.97 | 0.4441 | ||||
| Hispanic | 23 | 2.31 | 0.67-7.90 | 0.1826 | ||||
| White | 30 | 1.78 | 0.53-5.92 | 0.3502 | ||||
| Diabetes | ||||||||
| No | 125 | ref | ||||||
| Yes | 32 | 0.90 | 0.57-1.42 | 0.6410 | ||||
| Macrovascular invasion | Macrovascular invasion | |||||||
| No | 149 | ref | No | ref | ||||
| Yes | 9 | 1.64 | 0.80-3.38 | 0.1789 | Yes | 1.94 | 0.90-4.18 | 0.0916 |
| Cirrhosis | ||||||||
| No | 35 | ref | ||||||
| Yes | 129 | 1.08 | 0.69-1.67 | 0.7429 | ||||
| Surveillance | ||||||||
| No | 51 | ref | ||||||
| Yes | 113 | 0.70 | 0.48-1.02 | 0.0647 | ||||
| Treatment | Treatment | |||||||
| Supportive | 44 | ref | Supportive | ref | ||||
| Chemotherapy | 7 | 1.78 | 0.79-4.00 | 0.1654 | Chemotherapy | 3.00 | 1.28-7.01 | 0.0112 |
| OLT | 26 | 0.13 | 0.06-0.27 | 0 | OLT | 0.14 | 0.07-0.30 | 0 |
| Resection | 21 | 0.40 | 0.21-0.74 | 0.0039 | Resection | 0.54 | 0.28-1.06 | 0.0716 |
| RFA | 29 | 0.50 | 0.29-0.84 | 0.0099 | RFA | 0.58 | 0.33-1.02 | 0.0596 |
| PEI | 7 | 0.59 | 0.25-1.40 | 0.2324 | PEI | 0.67 | 0.25-1.79 | 0.4249 |
| TACE | 30 | 0.92 | 0.57-1.50 | 0.7464 | TACE | 1.15 | 0.68-1.93 | 0.6056 |
Multivariate analysis using the Cox model with backward AIC search identified TGR (HR = 1.34, 95%CI: 1.03-1.74, P = 0.029), age > 56 years (HR = 1.08, 95%CI: 0.99-1.18, P = 0.072), HCV (HR = 1.44, 95%CI: 0.94-2.20, P = 0.091), macrovascular invasion (HR = 1.94, 95%CI: 0.90-4.18, P = 0.092), and the most definitive treatments (OLT, HR = 0.14, P < 0.0001; surgical resection, HR = 0.54, P = 0.072; RFA, HR = 0.58, P = 0.060) as simultaneous independent risk factors for recurrence-free survival. To evaluate the effect of the same level of slow or fast growth rate on recurrence-free survival, the 164 patients were divided into equal-sized groups below and above the median TGR (17.8% per month). The median TGR in the slower group was 4.58% per month and the median TGR in the faster group was 38.9% per month. As illustrated in Figure 3, the recurrence-free survival in patients who received OLT, surgical resection, or RFA was significantly longer in patients with slow TGRs for each treatment modality (P = 0.029). Patients who received OLT who had slow TGRs had the longest recurrence-free survival. Those HCC patients who received surgical resection or RFA had similar survival rates in both the slow and fast TGR groups. The poorest recurrence-free survivals were observed in the TACE treated or supportive care patients with fast TGRs.
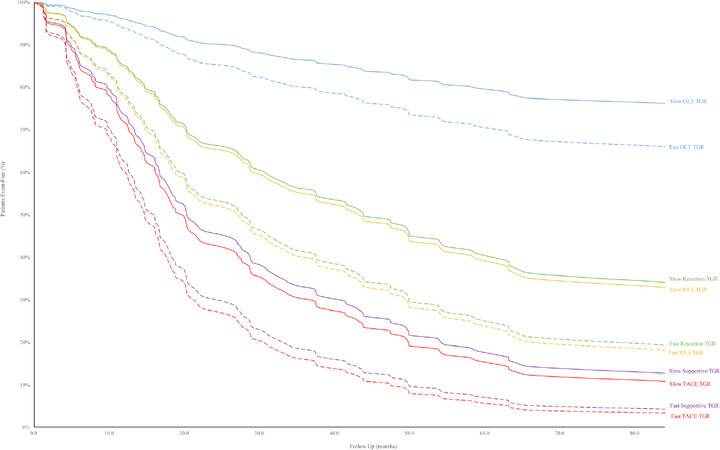
Figure 3. Recurrence-free survival in hepatocellular carcinoma patients with slow vs. fast tumor growth rate by treatment category. TGR: tumor growth rate; OLT: orthotopic liver transplantation; RFA: radiofrequency ablation; TACE: transarterial chemoembolization
Discussion
Previous reports have utilized MRI or CT to find potential biomarkers to predict clinical outcomes in patients with HCC. Using MRI, one report showed that patients with fat-containing HCC had less tumor progression, less distant metastases, and a longer time to tumor progression when compared to patients with non-fat containing HCC[16]. Another report showed that patients with complete tumor encapsulation on MRI had lower AFP levels, an absence of vascular invasion, more patients in Child-Pugh class A, and significantly longer survivals[17]. Further, the authors also noted that the rates of downstaging and eventual liver transplantation were significantly higher. However, recognition of these imaging features depends on the expertise of the interpreting radiologist and may be challenging to implement as a practical clinical tool. Nevertheless, efforts to standardize imaging reporting (i.e., Organ Procurement and Transplantation Network/United Network for Organ Sharing (OPTN) and Liver Imaging Reporting and Data System (LI-RADS) criterion) may allow incorporation of additional important imaging biomarkers for tumor prognosis[18,19]. As tumor size is already a basic measure reported with all detected tumors, the calculation of TGR is feasible when serial imaging is available and, thus, may be considered as another potential imaging biomarker.
In the report herein, we first attempted to determine factors associated with tumor growth rate in patients with HBV- and HCV-related HCC. By regression tree analysis of 19 variables, AFP levels < or > 16.7 ng/mL best discriminated between slow and fast growing tumors respectively [Figure 1]. In a previous report, the initial AFP levels did not correlate with tumor growth rate but, in those patients with repeated AFP values which showed an exponential increase in AFP, the AFP doubling time was closely related to the tumor doubling time[6]. Other studies comparing AFP values > 100 ng/mL, > 200 ng/mL, and > 400 ng/mL showed that each of the AFP levels correlated with faster tumor doubling times[10,11,20]. These findings indicate that elevated AFP levels are significant indicators of tumor doubling time.
In patients with AFP ≥ 16.7 ng/mL, the next best discriminator was platelet counts < or > 140,000 mm3. Within the platelet count ≥ 140,000 mm3 node, the mean platelet count was 201,345 mm3 (median 192,000 mm3). There were only two patients with thrombocytosis (385,000 mm3 and 420,000 mm3). In previous reports, thrombocytosis was noted in 2.70% to 8.20% of HCC patients and was associated with overproduction of thrombopoietin by liver cancer cells[21,22]. In these studies, thrombocytosis was associated with larger tumor volumes and higher levels of serum AFP in Asian HCC patients, and with larger tumor sizes, younger patients, and less cirrhosis in European HCC patients. One possible explanation for large tumor sizes in patients with higher platelet counts or in cirrhotic patients with “higher than expected” platelet counts is that platelets are a source of a number of HCC growth stimulants including vascular endothelial growth factor, platelet-derived growth factor, serotonin, and fibroblast growth factor[22]. In the study herein, patients with platelet counts ≥ 140,000 mm3 had a faster mean TGR compared to those with platelet counts < 140,000 mm3 (39.4% per month vs. 21.0% per month, respectively).
There have been few reports on the relationship between serum albumin levels and tumor doubling time. In earlier studies, Child-Pugh scores did not influence tumor doubling times[6,20]. A recent study showed that Korean HCC patients with tumor doubling times < 2 months had significantly lower mean albumin levels than those with tumor doubling times > 2 months (3.20 g/dL vs. 3.50 g/dL, P = 0.003)[23]. In our report, the TGR of patients in the platelet count < 140,000 mm3 node were further discriminated into fast and slow TGR by albumin levels < or > than 3.55 g/dL (31.4% per month vs. 9.15% per month). This finding suggests that cirrhosis patients with poor liver synthetic function have less ability to confine the growth of HCC.
In our study, TGR significantly influenced recurrence-free survival in patients who received OLT, surgical resection, or RFA. In each of these treatments, recurrence-free survival was significantly longer in patients with slow TGRs. Prolonged recurrence-free survival was observed in patients with slow TGRs who received OLT. The recurrence-free survival was similar in patients with slow or fast TGRs who received surgical resection or RFA. Also, survival was similar in patients who had TACE or supportive care, regardless of TGRs. The poorest recurrence-free survival was observed in patients who received either of the latter two treatments and who had fast TGRs. These findings indicate that TGRs may be a useful biomarker when evaluating HCC patients for treatments and in predicting outcomes to therapies.
While this study strongly supports TGR as a simple imaging-based prognostic biomarker, we should comment that both OPTN and LI-RADS use 6 month threshold growth of 50% as an ancillary criteria for HCC diagnosis, largely based on expert opinion from the OPTN imaging committee[20,21]. We believe that this diagnostic definition may be too restrictive in patients with fast TGRs and may possibly affect prognosis since potential HCCs with a fast TGR may be left untreated for an extended period if the OPTN and LI-RADS criterion is used. Therefore, measurement of TGR may also be of use in establishing criteria for diagnosis of early HCC. Future studies using TGR along with other imaging criteria will assist in this endeavor.
There are limitations to our study. This was a retrospective analysis of HCC patients from a single community specialty clinic. However all HCC treatments were performed at a university center where multi-disciplinary subspecialities were active in the care of these patietns. This scenario is much more representative of the real world setting since issues of long-term follow-up, financial constraints, and day to day care all came into play. Also, patients who did not have a second imaging study prior to HCC treatments were excluded from our analysis which may have biased patient selection. We did not compare the clinical outcome between patients who did or did not have a second imaging study, which may have clarified this issue. Also, we excluded patients with diffuse tumors since the diameter of the tumor could not be determined. However, these patients are usually not eligible for surgical or interventional radiologic treatment and have much shorter life expectancies. Further, only HCC patients with HBV or HCV were evaluated in this report. As such, additional studies should include other disease entities such as alcohol-related and nonalcoholic fatty liver disease-related HCC cases.
In summary, our findings suggest that TGR is influenced by AFP, platelet counts, and albumin levels. TGR significantly influenced recurrence-free survival and response to surgical and locoregional treatments and may be another potential imaging biomarker to predict clinical outcomes in patients with HCC.
Declarations
AcknowledgmentsJeffery Gornbein, Ph.D., assisted in the statistical analysis of the data; Lori Tong, RN, MSN, participated in the care of these patients; Alex Rosinski, B.S., M.A., assisted in the collection of data in this study.
Authors’ contributionsStudy concept and design: Tong MJ
Acquisition of data: Kaki DA, Huynh CT
Analysis and interpretation of data: Tong MJ, Raman SS, Lu DS
Drafting the manuscript: Tong MJ, Kaki DA, Raman SS, Lu DS
Critical revision of the manuscript: Tong MJ, Raman SS, Lu DS
Availability of data and materialsNot applicable.
Financial support and sponsorshipNone.
Conflicts of interestAll authors declared that there are no conflicts of interest.
Ethical approval and consent to participateNot applicable.
Consent for publicationNot applicable.
Copyright© The Author(s) 2019.
REFERENCES
1. Bertuccio P, Turati F, Carioli G, Rodriguez T, La Vecchia C, et al. Global trends and predictions in hepatocellular carcinoma mortality. J Hepatol 2017;67:302-9.
2. Rahib L, Smith BD, Aizenberg R, Rosenzweig AB, Fleshman JM, et al. Projecting cancer incidence and deaths to 2030: the unexpected Burden of thyroid, liver, and pancreas cancers in the United States. Cancer Res 2014;74:2913-21.
3. Jinjuvadia R, Salami A, Lenhart A, Jinjuvadia K, Liangpunsakul S, et al. Hepatocellular carcinoma: a decade of hospitalizations and financial Burden in the United States. Am J Med Sci 2017;354:362-9.
4. de Martel C, Maucort-Boulch D, Plummer M, Franceschi S. World-wide relative contribution of hepatitis B and C viruses in hepatocellular carcinoma. Hepatology 2015;62:1190-200.
5. Tong MJ, Rosinski AA, Huynh CT, Raman SS, Lu DSK. Long-term survival after surveillance and treatment in patients with chronic viral hepatitis and hepatocellular carcinoma. Hepatol Commun 2017;1:595-608.
6. Sheu JC, Sung JL, Chen DS, Yang PM, Lai MY, et al. Growth rate of asymptomatic hepatocellular carcinoma and its clinical implications. Gastroenterology 1985;89:259-66.
7. Taouli B, Goh JSK, Lu Y, Qayyum A, Yeh BM, et al. Growth rate of hepatocellular carcinoma: evaluation with serial computed tomography or magnetic resonance imaging. J Comput Assist Tomogr 2005;29:425-9.
8. Okazaki N, Yoshino M, Yoshida T, Suzuki M, Moriyama N, et al. Evaluation of the prognosis for small hepatocellular carcinoma based on tumor volume doubling time: a preliminary report. Cancer 1989;63:2207-10.
9. Cucchetti A, Vivarelli M, Piscaglia F, Nardo B, Montalti R, et al. Tumor doubling time predicts recurrence after surgery and describes the histological pattern of hepatocellular carcinoma on cirrhosis. J Hepatol 2005;43:310-6.
10. Park Y, Choi D, Lim HK, Rhim H, Kim Y, et al. Growth rate of new hepatocellular carcinoma after percutaneous radiofrequency ablation: evaluation with multiphase CT. Am J Roentgenol 2008;191:215-20.
11. Mehrara E, Forssell-Aronsson E, Ahlman H, Bernhardt P. Specific growth rate versus doubling time for quantitative characterization of tumor growth rate. Cancer Res 2007;67:3970-5.
12. Bruix J, Sherman M. Management of hepatocellular carcinoma: an update. Hepatology 2011;53:1020-2.
13. Bruix J, Sherman M; Proactive Guidelines Committee; American Association for the Study of Liver Disease. Managemtn of hepatocellular carcinoma. Hepatology 2005;42:1208-36.
15. Breiman L. Classification and Regression Trees. Boca Raton: Chapman & Hall [u.a.]; 1998. p. 358.
16. Siripongsakun S, Lee JK, Raman SS, Tong MJ, Sayre J, et al. MRI detection of intratumoral fat in hepatocellular carcinoma: potential biomarker for a more favorable prognosis. Am J Roentgenol 2012;199:1018-25.
17. Lu DS, Siripongsakun S, Kyong Lee J, Wei SH, Cheng PM, et al. Complete tumor encapsulation on magnetic resonance imaging: a potentially useful imaging biomarker for better survival in solitary large hepatocellular carcinoma. Liver Transpl 2013;19:283-91.
18. Chernyak V, Sirlin CB. The LI-RADS v2018 CT/MRI Manual [Internet]. The American College of Radiology; 2018 Jul. Available from: https://www.acr.org/-/media/ACR/Files/RADS/LI-RADS/LI-RADS-2018-Core.pdf?la=en. [Last accessed on 20 Sep 2019].
19. Rosenkrantz AB, Campbell N, Wehrli N, Triolo MJ, Kim S. New OPTN/UNOS classification system for nodules in cirrhotic livers detected with MR imaging: effect on hepatocellular carcinoma detection and transplantation allocation. Radiology 2015;274:426-33.
20. An C, Choi YA, Choi D, Paik YH, Ahn SH, et al. Growth rate of early-stage hepatocellular carcinoma in patients with chronic liver disease. Clin Mol Hepatol 2015;21:279.
21. Hwang SJ, Luo JC, Li CP, Chu CW, Wu JC, et al. Thrombocytosis: a paraneoplastic syndrome in patients with hepatocellular carcinoma. World J Gastroenterol 2004;10:2472-7.
Cite This Article
Export citation file: BibTeX | RIS
OAE Style
Tong MJ, Kaki DA, Huynh CT, Raman SS, Lu DS. Tumor growth rates and recurrence-free survival in chronic viral hepatitis patients with hepatocellular carcinoma. Hepatoma Res 2019;5:36. http://dx.doi.org/10.20517/2394-5079.2019.005
AMA Style
Tong MJ, Kaki DA, Huynh CT, Raman SS, Lu DS. Tumor growth rates and recurrence-free survival in chronic viral hepatitis patients with hepatocellular carcinoma. Hepatoma Research. 2019; 5: 36. http://dx.doi.org/10.20517/2394-5079.2019.005
Chicago/Turabian Style
Tong, Myron J., Dahlia A. Kaki, Claiborne T. Huynh, Steven S. Raman, David S. Lu. 2019. "Tumor growth rates and recurrence-free survival in chronic viral hepatitis patients with hepatocellular carcinoma" Hepatoma Research. 5: 36. http://dx.doi.org/10.20517/2394-5079.2019.005
ACS Style
Tong, MJ.; Kaki DA.; Huynh CT.; Raman SS.; Lu DS. Tumor growth rates and recurrence-free survival in chronic viral hepatitis patients with hepatocellular carcinoma. Hepatoma. Res. 2019, 5, 36. http://dx.doi.org/10.20517/2394-5079.2019.005
About This Article
Special Issue
Copyright

Data & Comments
Data
0

 Cite This Article 4 clicks

 Like This Article 34
likes
Like This Article 34
likes


Comments
Comments must be written in English. Spam, offensive content, impersonation, and private information will not be permitted. If any comment is reported and identified as inappropriate content by OAE staff, the comment will be removed without notice. If you have any queries or need any help, please contact us at support@oaepublish.com.