
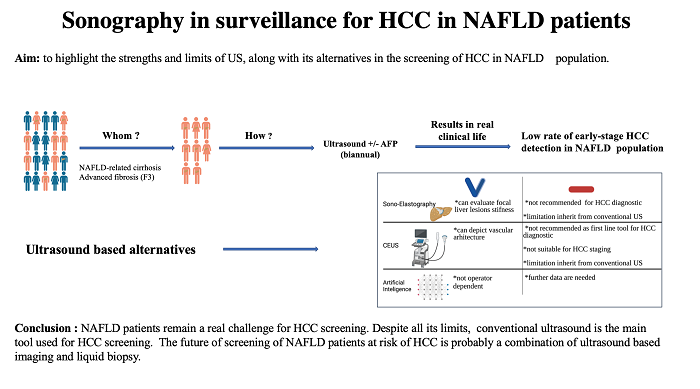
Sonography in surveillance for HCC in NAFLD patients
 0
0 ,
, Abstract
Over the last decade, we have been facing a new aetiology responsible for the development of HCC - the non-alcoholic fatty liver disease (NAFLD). The prevalence of HCC development in this group is higher than that observed in the general population and in non-cirrhotic subjects with other causes of liver disease. Conventional ultrasound (US) is the first-line tool for HCC surveillance, but, in this population, it has a decreased diagnostic accuracy due to several particular features, including obesity and steatosis. Contrast-enhanced ultrasound (CEUS) appeared as a new branch of US due to its ability to depict the vascular architecture of all types of focal lesions (FLs). Nevertheless, CEUS has several limitations besides those inherited from US, which renders this method unreliable as the first-line HCC diagnostic tool and for HCC staging. Artificial intelligence eliminates operator limitations, which has led to an increased sensitivity and specificity of US. However, this approach is still in its early stages and more data are needed. Consequently, the purpose of the current study is to highlight the strengths and limits of US, along with its alternatives to HCC screening in NAFLD population.
Keywords
INTRODUCTION
Due to the associated co-morbidities (i.e., obesity, metabolic syndrome and type 2 diabetes mellitus) and complications, non-alcoholic fatty liver disease (NAFLD) has become one of the leading causes of morbidity and mortality globally, affecting approximately 25% of the world’s population[1,2]. NAFLD is the most common aetiology of chronic liver disease as a major cause of cirrhosis and non-viral HCC. It is expected to become the leading aetiology for liver transplantation this decade[1,3].
Cohort studies from Italy and the United States reported that the majority of NAFLD-related HCC patients are not diagnosed through regular surveillance, resulting in a more advanced HCC stage at diagnosis[4,5]. Furthermore, several authors reported that, despite a preserved liver function, these patients are generally older with more co-morbidities, which are factors that limit the use of curative treatment leading to a worse prognosis[5-7]. Although NAFLD has a relatively low risk of HCC development, the high prevalence of NAFLD in the population and the impact on health costs underline the importance of this aetiology. Developing a risk stratification model is essential in selecting the appropriate management for each patient. Published data indicate that male patients with NAFLD are more susceptible to developing HCC than women with NAFLD at fertile age, whereas ageing and menopause are associated with an increased risk in women with NAFLD[8]. A better understanding of carcinogenesis related to NAFLD would provide important information concerning the selection of the subset of patients with a higher risk for HCC development. Different metabolic co-morbidities, such as obesity and diabetes, are being incriminated, along with the pro-inflammatory status, Hispanic ethnicity and genetic predisposition [i.e., genetic polymorphisms in patatin-like phospholipase domain-containing protein 3 (PNPLA3), transmembrane 6, superfamily member 2 (TM6SF2), glucokinase regulator (GCKR), membrane bound O-acyltransferase domain-containing 7 (MBOAT7) and hydroxysteroid 17-beta dehydrogenase 13 (HSD17B13)][9]. However, there are currently no validated “risk scores for HCC development” aimed at selecting NAFLD patients[10].
At present, the European Association for the Study of the Liver (EASL) and the American Gastroenterology Association Clinical Practice (AASLD) Update recommend HCC screening for patients with cirrhosis and consider screening in advanced fibrosis (F3)[11-13]. Since HCC occurrence has also been reported in the F0-F2 NAFLD population, there are still concerns that the HCC risk occurrence is underestimated[14]. Unfortunately, ultrasound keeps a low sensitivity in diagnosing HCC during the very early stage. Furthermore, US is an inefficient tool for HCC diagnosis in the NAFLD population due to specific sound conditions. In this context, it is obvious that we need to update the diagnostic tool to identify NAFLD patients at risk and diagnose them at an early stage. In recent years, artificial intelligence (AI) has shown encouraging results. However, since it is still in its early stages, more data are requested before it can be used in the current practice.
CONVENTIONAL ULTRASOUND AND COLOUR DOPPLER ULTRASOUND
The aim of US is to identify any area with a different echogenicity compared to the surrounding parenchyma and not to characterise it. Hepatocarcinogenesis is a multistep process that implies the changes within the tumour (i.e., fatty content, loosing of portal vessels, increasing arterial vascularity and necrosis). All these changes are reflected in the HCC appearance, leading to variable HCC features. Depending on its size, tumour echogenicity is defined as hypo (23%-54%), hyper (12%-38%) or mix echogenicity
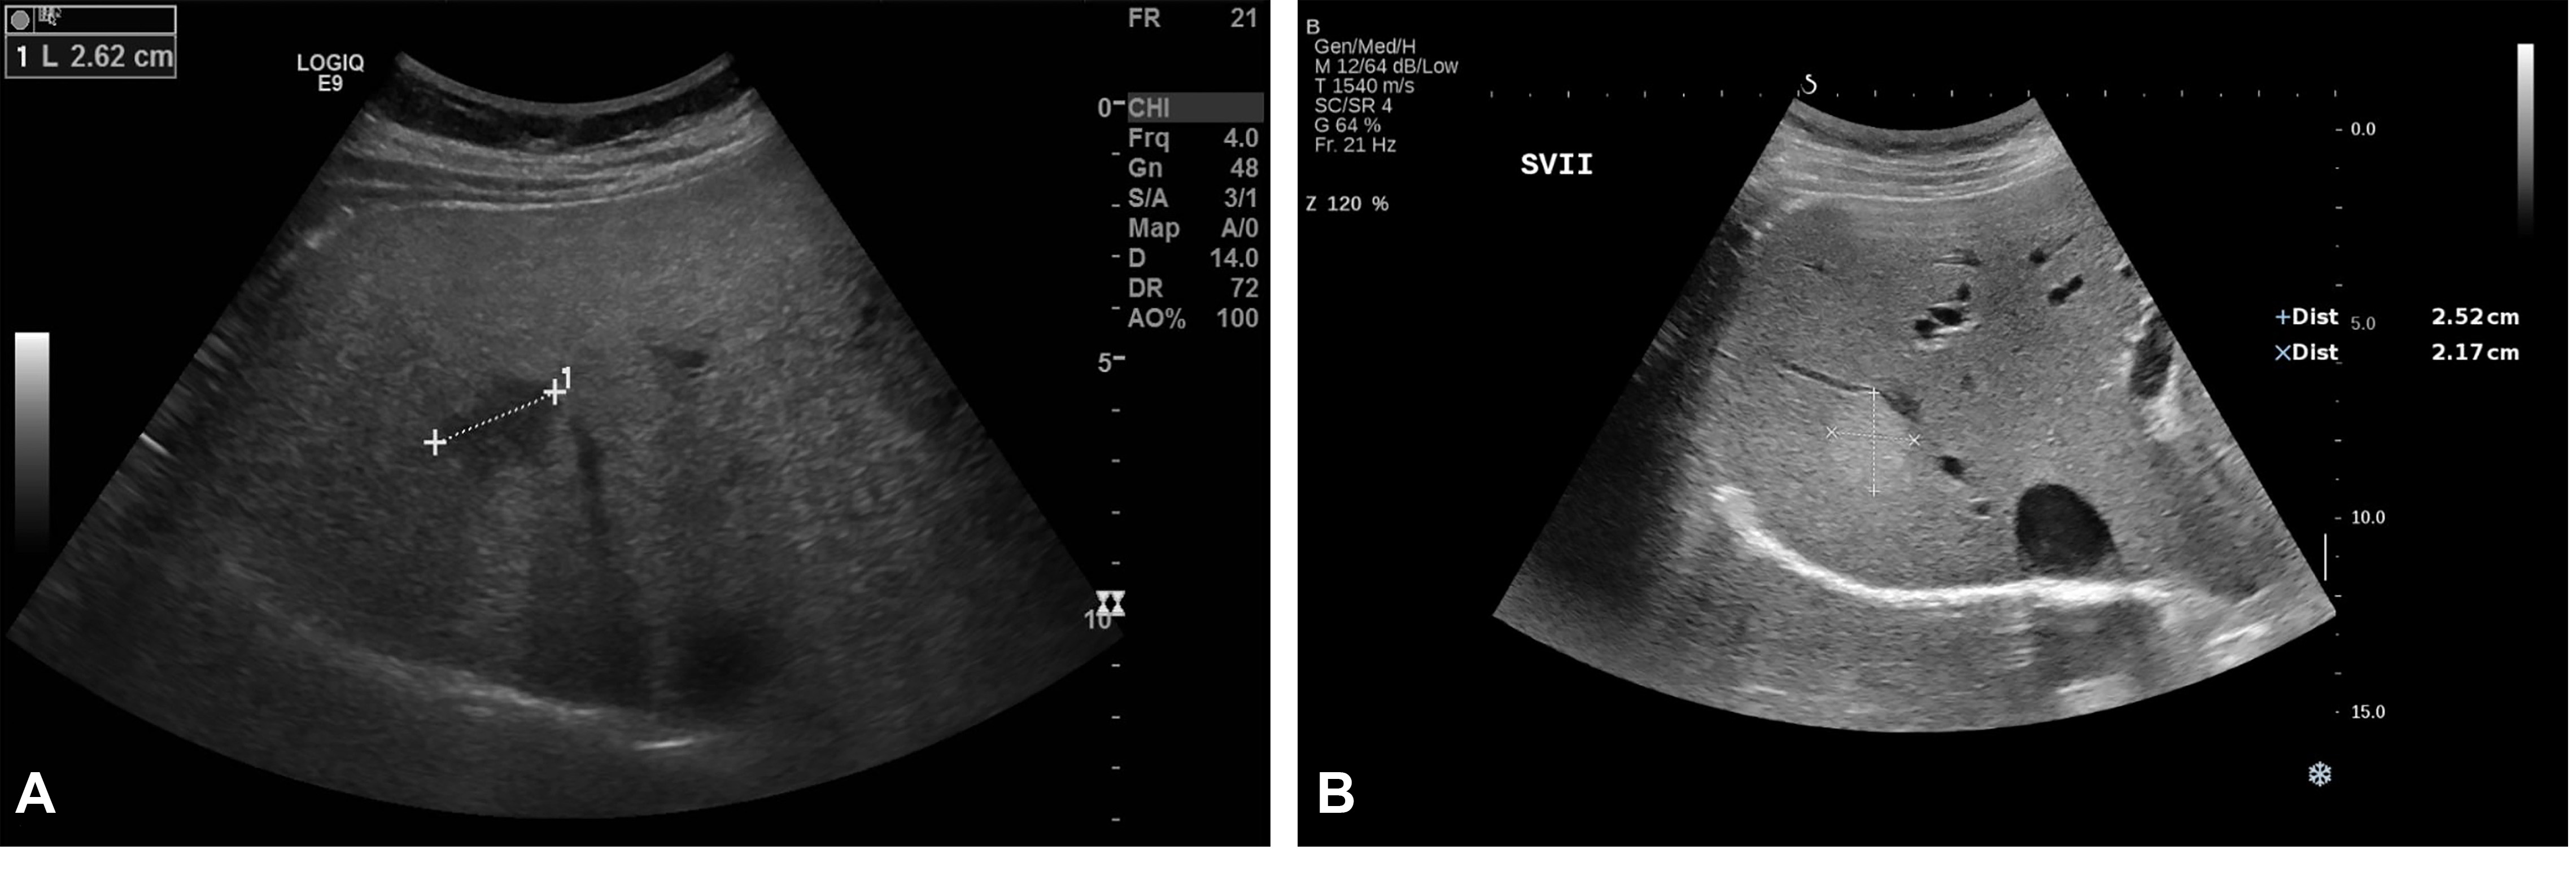
Figure 1. Liver haemangioma in a 40-year-old woman examined in the supine position. Conventional US revealed a hypoechoic lesion in segment VII and a liver parenchyma with an increased echogenicity (A). One year later, after the patient lost 10 kg, the known hypoechoic lesion described in segment VII had a hyperechoic appearance, typical for haemangiomas. The adjacent liver parenchyma had a significantly decreased echogenicity compared with the previous examination (B). Courtesy Dr. Delgado Gabriela, Department of Visceral Surgery and Medicine, Inselspital, Bern University Hospital, University of Bern, Bern 3008, Switzerland.
A “halo sign” is found in HCC with a fibrous capsule, but it can be found in benign tumours as well[15,17]. Thus, based only on the information provided by B mode, a differential diagnosis is not possible, and additional information concerning intratumoral vascularity is necessary [Figures 2 and 3].
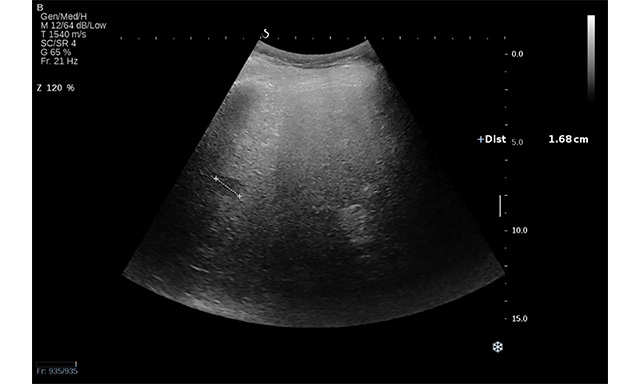
Figure 2. Conventional US revealed a hypoechoic lesion in segment VII in a 71-year-old man with non-alcoholic liver cirrhosis. Ultrasound attenuation can be observed in deep segments. The lesion was a hepatocellular carcinoma.
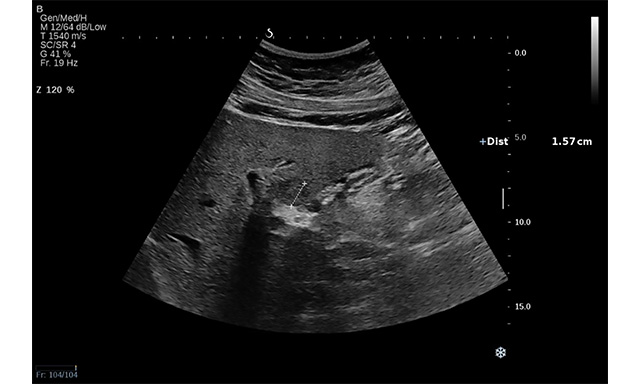
Figure 3. Conventional US revealed an isoechoic lesion with a hypoechoic halo in a 23-year-old woman diagnosed with non-alcoholic liver steatosis (arrow). CEUS examination followed, and, based on the contrast behaviour, the final diagnosis was focal nodular hyperplasia.
Colour Doppler mode offers additional information concerning the lesion’s vascularity without having the ability to establish the final diagnosis. The changes in intratumoral vascularisation that occur during tumour growth result in a shift from an afferent continuous waveform signal (HCC < 2 cm) to a pulsatile afferent flow with constant efferent flow and a very high pulsatility index (large HCC)[18,19].
According to a meta-analysis by Singal et al., US pooled sensitivity (Se) varied from 94% for detecting HCC at any stage to 63% for early-stage HCC[20]. Tzartzeva et al. reported the same wide variation of pooled Se of US, from 84% for HCC at any stage to 47% for early HCC[21].
Deep localisation (i.e., segment IVa, VII or VIII) and subcapsular localisation have been associated with inappropriate tumour visualisation and a high rate of misdiagnosis[22,23]. An important aspect that needs to be considered in the NAFLD population is the associated obesity, which limits image quality. Ultrasound waves are attenuated at a rate of 0.63 dB per centimetre of fat[24]. This finding also explains why patients with predominant subcutaneous fat distribution have a lower US image quality than those with predominant visceral fat. As reported by Uppot et al., the limitations in image quality start to become evident from the weight above 250 lbs.[25]. This was confirmed by Esfeh et al. who reported a decreased sensitivity from 59% (95%CI: 43%-74%) in non-obese patients to 19% (95%CI: 10%-28%) in obese patients (P-value < 0.001)[26]. Technical adjustments, such as the selection of the optimal sound frequency (a low sound frequency allows a higher penetration depth), changing gain and shifting the focus to a deeper region, are necessary to improve image quality[27].
Another aspect that must be considered is the infiltrative pattern of HCC associated with an increased risk of surveillance failure compared to the nodular type (57.1% vs. 2.1%; P < 0.001)[28]. Noteworthy, advanced HCC may coexist with a macrovascular invasion. Based on the thrombus echogenicity, US cannot differentiate between malignant and benign thrombus. Even though Colour Doppler can detect the presence of vessels, indicating malignity, the method’s sensitivity is lower than 20%[29] [Figure 4A and B]. Thus, US visualisation of macrovascular thrombosis requires further imaging with contrast agents.
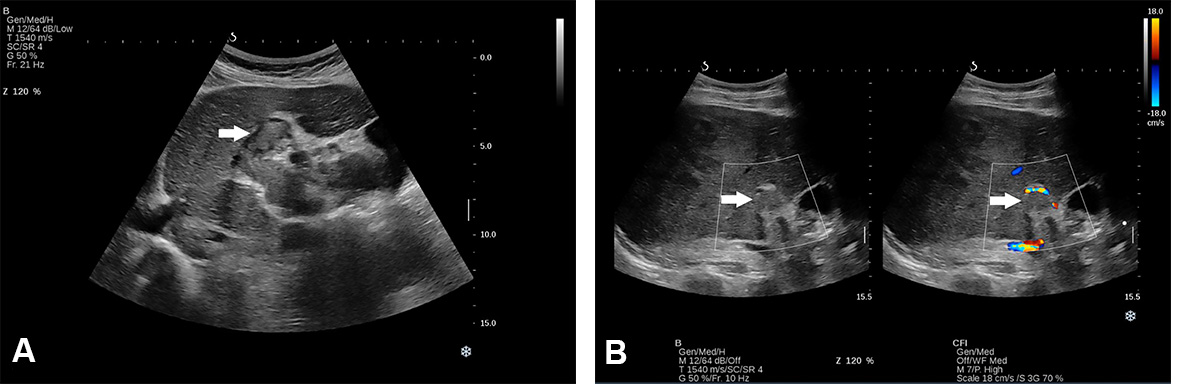
Figure 4. Thrombosis of portal vein (main, right and left branch) in a 62-year-old man recently diagnosed with NASH-related cirrhosis in B mode (A) and Doppler mode (B).
To improve the imagining surveillance, the American College of Radiology (ACR) released the Ultrasound Liver Imaging Reporting and Data System (US LI-RADS) algorithm in 2017[30]. According to the LI-RADS algorithm, the size determines the following steps to diagnosis. Lesions measuring less than 1 cm are challenging to be accurately characterised, regardless of the imaging method. Hence, cross-sectional imaging is not required, and short-term follow-up with repeat ultrasonography after 3-4 months is sufficient. If the tumour remains unchanged after two years of surveillance, malignancy is excluded, and the patient returns to the normal screening program. For lesions ≥ 1 cm in diameter, either quadruple-phase CT or dynamic contrast-enhanced MRI should be performed to establish the diagnosis[11,12].
Contrast-enhanced ultrasonography
Contrast-enhanced ultrasonography (CEUS) enables physicians to assess the vascular architecture of focal hepatic lesions once detected by depicting the vessels against the background parenchyma. Currently, there are four ultrasound contrast agents (UCAs) approved by the Food and Drug Administration: SonoVue/Lumason (Bracco Suisse SA, Geneva, Switzerland), Definity/Luminity (Lantheus Medical Imaging, Inc., North Billerica, MA, USA), Optison (Perflutren Protein-Type A Microspheres Injectable Suspension, GE Healthcare, Princeton, NJ) and Sonazoid (GE Healthcare AS, Oslo, Norway)[31]. Sonazoid is the only UCA with a hepatic parenchyma-specific Kupffer phase, enabling the physician to obtain images similar to MRI examination[32]. In April 2016, the United States Food and Drug Administration (FDA) approved Lumason for intravenous liver applications in children[33].
Based on the arterial enhancement pattern and presence/absence of washout phenomena in the portal venous and delayed phases, the lesion can be characterised by CEUS. As a general rule, the lack of washout during the portal venous and late phase indicates a benign lesion, in which case the arterial enhancement pattern indicates the type of lesion [Figure 5A-C].
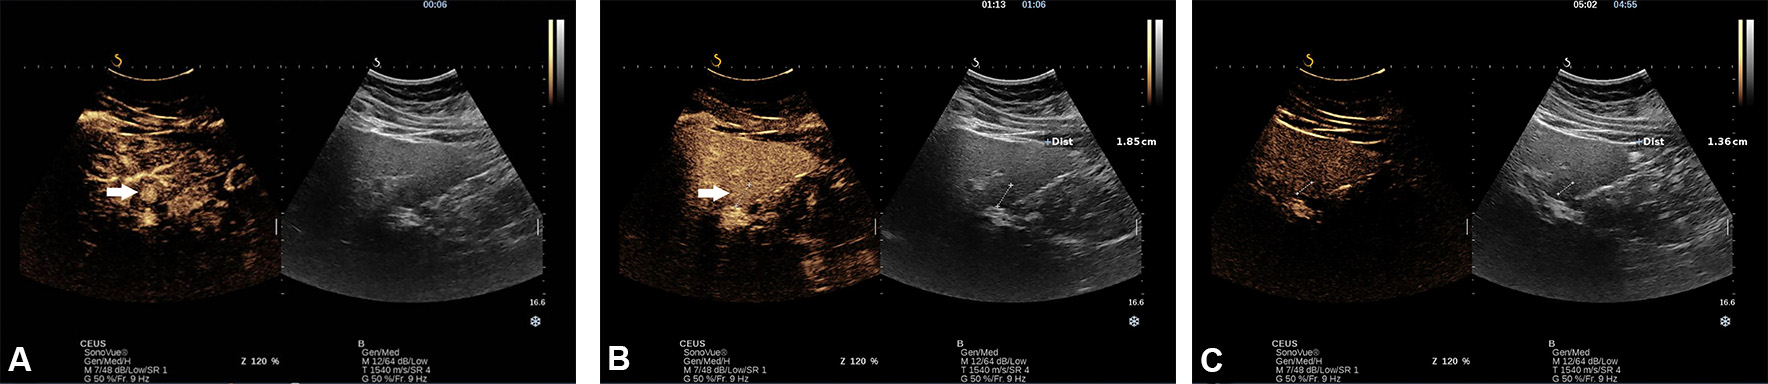
Figure 5. Incidentally, hyperechoic lesion with a hypoechoic halo in a 23-year-old woman diagnosed with non-alcoholic liver steatosis. A CEUS with SonoVue was performed. In the early arterial phase, there was a rapid spoke-wheel enhancement of the lesion (arrows) from the centre to the periphery (A). In portal venous (B) and late phase, the lesion remained iso-enhanced compared with adjacent liver parenchyma, indicating that the lesion is benign (C).
The typical contrast behaviour for HCC is arterial hyperenhancement followed by mild late or very late washout (> 60 s)[34,35].
In a recent meta-analysis of 53 studies, Zhang et al. reported that CEUS has a pooled Se of 85% and a Sp of 91%[36]. For FL ≤ 2 cm, Huang et al. reported a sensitivity of 73.3% and a specificity of 97.1%, which is comparable to the Se and Sp of MRI[37].
Contrast enhancement within the thrombus is a pathognomonic sign for tumour thrombosis, while no enhancement indicates benignity. CEUS has been reported to have high sensitivity and specificity (90.9% and 100%, respectively) in diagnosing malignant thrombus[30,31] [Figure 6].
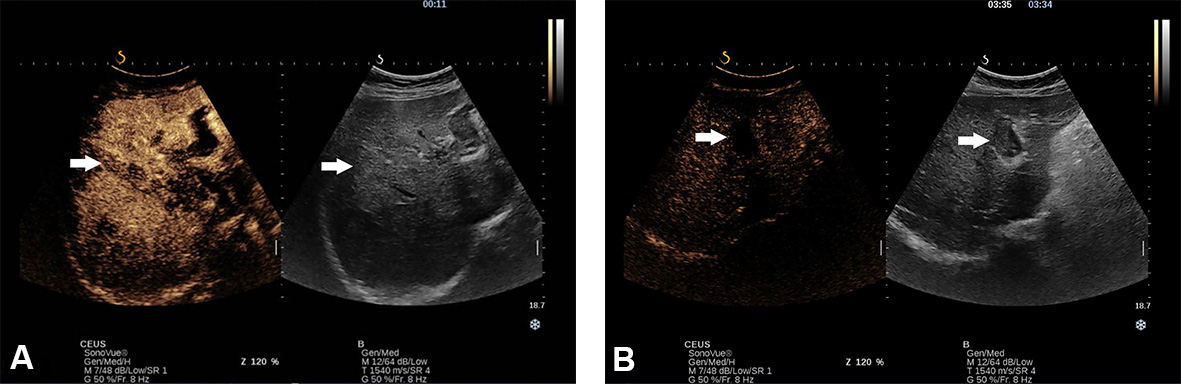
Figure 6. Thrombosis of portal vein (main, right and left branch) in a 62-year-old man recently diagnosed with NASH-related cirrhosis. At CEUS examination, with SonoVue, the thrombus presented arterial hyperenhancement (A) with washout in the late phase (B).
In the NAFLD population, CEUS has a lower performance compared to conventional US due to the self-shadowing of microbubbles and the low mechanical index used during CEUS examination[38].
Putz JF reported that, in patients with limited sound conditions (i.e., obesity and meteorism), the diagnostic accuracy was 92.6% compared with 98% in patients with good sound conditions[39]. Several strategies may be used to reduce these limitations, such as bringing the FL closer to the transducer (i.e., intercostal positioning of the transducer or supine position) and reducing or increasing the dose of UCA or the mechanical index depending on the FL localisation[40].
EASL guidelines have endorsed CEUS as a second-line tool in patients with main contraindications or inconclusive contrast-enhanced computed tomography (CT) or magnetic resonance imaging (MRI)[9].
Ultrasound Elastography
Although elastographic techniques, such as point shear wave elastography (pSWE) and 2D-Shear wave elastography (2D-SWE), have been used for staging and monitoring liver fibrosis, several authors have used these techniques to evaluate the FL stiffness. According to the published data, benign FLs are softer than their malignant counterparts and indicate an ascending order of stiffness of FLLs: haemangiomas < FNH < HCC < metastases[36,41]. Of note, Dong et al. found an overlapping of the rigidity between different lesions, such as between HCC and FNH[42]. These overlaps result from the presence of fibrous tissue and the degree of vascularisation in the focal lesion; fibrous tissue tends to increase stiffness, while highly vascularised lesions tend to be softer[43].
The deep location of FL, more than 8 cm from the skin, does not allow the measurement of stiffness[44,45]. Obesity seems to limit the successful rate of valid measurements of SWE. A meta-analysis by Hu X found that patients with successful SWE measurements had a lower body mass index than those with unsuccessful measurements[46]. Another limitation relates to the susceptibility of motion-related factors that can lead to an inaccurate value, especially for lesions located in the left lobe. Furthermore, a high liver stiffness (i.e., cirrhosis) increases through compression the stiffness of a FL, making it difficult to differentiate a malignant lesion from a benign lesion[47].
Nevertheless, despite being an imperfect diagnostic tool, the US elastography adds a new dimension to conventional US by providing additional information concerning the FL stiffness. Currently, ultrasound elastography is not recommended for the characterisation of FLs; however, in a few situations, FL stiffness may orientate the diagnosis[48]. Therefore, further studies are required to evaluate the accuracy of this method in the characterisation of FLs, especially in NAFLD patients.
Table 1 summarises the indications, advantages and disadvantages of conventional US, CEUS and US elastography
Indications, advantages and disadvantages of ultrasound and new derived branches
| Method | Indications | Advances | Disadvantages |
| Ultrasonography | HCC surveillance for high-risk patients Guide percutaneous interventions (biopsies, MWA, RFA) | Inexpensive; fast, can be performed bedside; real-time; repeatable; no radiation exposure | Operator, patient and device dependency; deep location (i.e., VII, VIII, IV a) or subcapsular lesions might not be identified; cannot establish the nature of the lesion. |
| CEUS | Lesions’ characterisation (i.e., malignant/benign, vascular malformation); guiding the percutaneous interventions (e.g., biopsy, MWA, RFA) | Real-time evaluation; relatively inexpensive; no induced nephrotoxicity and low-risk allergic reactions; repeatable; can depict the vascularity, allowing not only lesions’ characterisation but also the necrotic/viable areas or inconspicuous lesions on US Has a higher accuracy in characterising pseudovascular lesions than CT or MRI (i.e., shunts) | Operator, patient and device dependency; cannot characterise deep or subcapsular located lesions; can evaluate only one lesion; thus, for multiple lesions located in different segments, multiple injections are needed Cannot exclude extrahepatic metastasis, and thus cannot be used for staging |
| US elastography | Evaluates liver stiffness; evaluates focal liver lesion’s stiffness | Non-invasive method; repeatable; inexpensive | Operator, patient and device dependency; deeply located lesions cannot be evaluated; high sensitivity to motion (i.e., movements induced by heart, non-compliant patients); sampling bias; overlapping stiffness values between malignant and benign lesions |
Artificial Intelligence as a potential future alternative
Artificial intelligence (AI) is a promising tool for radiologic diagnosis in several research studies with potential future applications in clinical practice. In medicine, two approaches have demonstrated promising results: machine learning (ML) and deep learning (DL) models. ML is a branch of AI based on the idea that the system can automatically improve based on its own experience. DL represents a subtype of ML models inspired by the neuroanatomy of the human brain, which uses many layers of artificial neurons called neural networks[49]. Convolutional neural networks (CNNs) are a subtype of DL that specialises in processing imaging data.
Despite the positive results, AI is confronted by several issues (i.e., the lack of standardisation of the used algorithms and software, the scarcity of data required to train the system, and the fact that data processing is still incomprehensible to users) that need to be resolved in order to become a reliable diagnostic tool in clinical practice[50].
Table 2 summarises several studies that have evaluated the feasibility of US-based AI in the diagnosis of HCC.
Studies evaluating the feasibility of US-based artificial intelligence in the diagnosis of hepatocellular carcinoma
| Autor, year | Images (n) | Method | AI vs. experienced physician (%) | FLL detection and characterisation | Reference |
| Hassan, 2017 | 110 images | DL | NA | Accuracy/Se/Sp HCC: 98.6%/98.3%/98.9% Overall accuracy: 97.2% | [51] |
| Yamakawa, 2019 | 446 videos | DL | Overall detection rate 89.8(95%CI: 84.5-95) vs. 70.9(95%CI:63-78.8) | Accuracy diagnosis Cysts/hemangiomas/HCC 98.1%/86.8%/ 86.3% | [52] |
| Schmauch et al., 2019 | 367 images | DL | NA | Lesion detection AUC: 0.935 HCC diagnosis AUC: 0.931 | [53] |
| Nishida et al., 2022 | Model 1:24.675 images Model-2 57.145 images Model-3 70,950 images | CNN 3 models | Overall detection 80; 81.8; 89.1 vs. 67.3 | HCC diagnosis for each model Se: 64.6%, 68.1%, 67.5% Sp: 93.8%, 96.0%, 96.0% Overall Accuracy: 83.3% Hemangiomas diagnosis for each model Se: 91.2%, 94.6%, 94.6% Sp: 93.9%, 96.6%, 96.5% Cysts diagnosis for each model Se: 98.5%, 98.9%, 99.0% Sp: 98.7%, 98.8%, 98.8% | [54] |
| Tiyarattanachai et al., 2022 | 446 videos | CNN | Overall detection rate: 89.8 vs. 70.9 | HCC detection: 100% (95%CI: 85.2%-100%) Cysts detection: 82.4% (95%CI: 69.5 %-95.2%) Hemangiomas detection: 85.2% (95%CI: 71.8%-98.6%) | [55] |
CONCLUSION
Conventional US is the mainstay in screening HCC high-risk patients. However, despite all the advantages and progressions made in ultrasonography, this method remains operator- and patient-dependent, which represents a real challenge, especially in the NAFLD-related HCC population.
The development of AI could potentially improve the power of US-based methods and, finally, benefit the patient for the early detection of NAFLD-related HCC. In the future, patients at risk of NAFLD-HCC may be screened using a combination of sonography imaging with liquid biopsy.
DECLARATIONS
AcknowledgementsThe graphical abstract was created with Biorender.
Authors’ contributionsLiterature review and drafted the manuscript: Radu P
Critical review of the manuscript for important intellectual content: Dufour JF
All authors approved of the final version.
Availability of data and materialsNot applicable.
Financial support and sponsorshipNone.
Conflicts of interestAll authors declare that there are no conflicts of interest.
Ethical approval and consent to participateNot applicable.
Consent for publicationNot applicable.
Copyright© The Author(s) 2022.
REFERENCES
1. Younossi ZM, Koenig AB, Abdelatif D, Fazel Y, Henry L, Wymer M. Global epidemiology of nonalcoholic fatty liver disease-meta-analytic assessment of prevalence, incidence, and outcomes. Hepatology 2016;64:73-84.
2. Younossi Z, Tacke F, Arrese M, et al. Global perspectives on nonalcoholic fatty liver disease and nonalcoholic steatohepatitis. Hepatology 2019;69:2672-82.
3. Caines A, Selim R, Salgia R. The Changing global epidemiology of hepatocellular carcinoma. Clin Liver Dis 2020;24:535-47.
4. Piscaglia F, Svegliati-Baroni G, Barchetti A, et al. ; HCC-NAFLD Italian Study Group. Clinical patterns of hepatocellular carcinoma in nonalcoholic fatty liver disease: a multicenter prospective study. Hepatology 2016;63:827-38.
5. Mittal S, Sada YH, El-Serag HB, Kanwal F, Duan Z, et al. Temporal trends of nonalcoholic fatty liver disease-related hepatocellular carcinoma in the veteran affairs population. Clin Gastroenterol Hepatol 2015;13:594-601.e1.
6. Than NN, Ghazanfar A, Hodson J, et al. Comparing clinical presentations, treatments and outcomes of hepatocellular carcinoma due to hepatitis C and non-alcoholic fatty liver disease. QJM 2017;110:73-81.
7. Weinmann A, Alt Y, Koch S, et al. Treatment and survival of non-alcoholic steatohepatitis associated hepatocellular carcinoma. BMC Cancer 2015;15:210.
8. Lonardo A, Ballestri S, Chow PKH, Suzuki A. Sex disparity in hepatocellular carcinoma owing to NAFLD and non-NAFLD etiology: epidemiological findings and pathobiological mechanisms. Hepatoma Res 2020;6:83.
9. Golabi P, Rhea L, Henry L, Younossi ZM. Hepatocellular carcinoma and non-alcoholic fatty liver disease. Hepatol Int 2019;13:688-94.
10. Ioannou GN. Epidemiology and risk-stratification of NAFLD-associated HCC. J Hepatol 2021;75:1476-84.
11. Marrero JA, Kulik LM, Sirlin CB, et al. Diagnosis, staging, and management of hepatocellular carcinoma: 2018 practice guidance by the american association for the study of liver diseases. Hepatology 2018;68:723-50.
12. Association for the Study of the Liver. Electronic address: easloffice@easloffice.eu., European Association for the Study of the Liver. EASL Clinical Practice Guidelines: Management of hepatocellular carcinoma. J Hepatol 2018;69:182-236.
13. Omata M, Cheng AL, Kokudo N, et al. Asia-Pacific clinical practice guidelines on the management of hepatocellular carcinoma: a 2017 update. Hepatol Int 2017;11:317-70.
14. Chrysavgis L, Giannakodimos I, Diamantopoulou P, Cholongitas E. Non-alcoholic fatty liver disease and hepatocellular carcinoma: clinical challenges of an intriguing link. World J Gastroenterol 2022;28:310-31.
15. Tanaka H. Current role of ultrasound in the diagnosis of hepatocellular carcinoma. J Med Ultrason (2001) 2020;47:239-55.
16. Kutami R, Nakashima Y, Nakashima O, Shiota K, Kojiro M. Pathomorphologic study on the mechanism of fatty change in small hepatocellular carcinoma of humans. J Hepatol 2000;33:282-9.
17. Hussain SM, Terkivatan T, Zondervan PE, et al. Focal nodular hyperplasia: findings at state-of-the-art MR imaging, US, CT, and pathologic analysis. Radiographics 2004;24:3-17; discussion 18.
18. Tochio H, Tomita S, Kudo M, et al. The efferent blood flow of early hepatocellular carcinoma and borderline lesions: demonstration by color Doppler imaging. J Med Ultrason (2001) 2002;29:205-9.
19. Tochio H, Kudo M. Afferent and efferent vessels of premalignant and overt hepatocellular carcinoma: observation by color Doppler imaging. Intervirology 2004;47:144-53.
20. Singal AG, Pillai A, Tiro J. Early detection, curative treatment, and survival rates for hepatocellular carcinoma surveillance in patients with cirrhosis: a meta-analysis. PLoS Med 2014;11:e1001624.
21. Tzartzeva K, Obi J, Rich NE, et al. Surveillance imaging and alpha fetoprotein for early detection of hepatocellular carcinoma in patients with cirrhosis: a meta-analysis. Gastroenterology 2018;154:1706-1718.e1.
22. Del Poggio P, Olmi S, Ciccarese F, et al. ; Italian Liver Cancer (ITA.LI.CA) Group. Factors that affect efficacy of ultrasound surveillance for early stage hepatocellular carcinoma in patients with cirrhosis. Clin Gastroenterol Hepatol 2014;12:1927-33.e2.
23. Kim YY, An C, Kim DY, Aljoqiman KS, Choi JY, Kim MJ. Failure of hepatocellular carcinoma surveillance: inadequate echogenic window and macronodular parenchyma as potential culprits. Ultrasonography 2019;38:311-20.
24. Uppot RN, Sahani DV, Hahn PF, Gervais D, Mueller PR. Impact of obesity on medical imaging and image-guided intervention. AJR Am J Roentgenol 2007;188:433-40.
25. Uppot RN. Technical challenges of imaging & image-guided interventions in obese patients. Br J Radiol 2018;91:20170931.
26. Esfeh JM, Esfeh JM, Hajifathalian K, Ansari-Gilani K. Sensitivity of ultrasound in detecting hepatocellular carcinoma in obese patients compared to explant pathology. Clin Mol Hepatol 2019;26:54-9.
27. Karlas T, Blank V, Böhlig A. Diagnostic value of ultrasound in fatty liver disease. Ultraschall Med 2021;42:128-53.
28. Sinn DH, Yi J, Choi MS, et al. Incidence and risk factors for surveillance failure in patients with regular hepatocellular carcinoma surveillance. Hepatol Int 2013;7:1010-8.
29. Tarantino L, Ambrosino P, Di Minno MN. Contrast-enhanced ultrasound in differentiating malignant from benign portal vein thrombosis in hepatocellular carcinoma. World J Gastroenterol 2015;21:9457-60.
30. Morgan TA, Maturen KE, Dahiya N, Sun MRM, Kamaya A. American College of Radiology Ultrasound Liver Imaging and Reporting Data System (US LI-RADS) Working Group. US LI-RADS: ultrasound liver imaging reporting and data system for screening and surveillance of hepatocellular carcinoma. Abdom Radiol (NY) 2018;43:41-55.
31. Dietrich CF, Nolsøe CP, Barr RG, et al. Guidelines and good clinical practice recommendations for contrast-enhanced ultrasound (CEUS) in the liver-update 2020 WFUMB in cooperation with EFSUMB, AFSUMB, AIUM, and FLAUS. Ultrasound Med Biol 2020;46:2579-604.
32. Jang JY, Kim MY, Jeong SW, et al. Current consensus and guidelines of contrast enhanced ultrasound for the characterization of focal liver lesions. Clin Mol Hepatol 2013;19:1-16.
33. Seitz K, Strobel D. A milestone: approval of CEUS for diagnostic liver imaging in adults and children in the USA. Ultraschall Med 2016;37:229-32.
34. Vogel A, Cervantes A, Chau I, et al. ; ESMO Guidelines Committee. Hepatocellular carcinoma: ESMO clinical practice guidelines for diagnosis, treatment and follow-up. Ann Oncol 2018;1;29(Suppl 4):iv238-55.
35. Vogel A, Cervantes A, Chau I, et al. Correction to: “Hepatocellular carcinoma: ESMO clinical practice guidelines for diagnosis, treatment and follow-up”. Ann Oncol 2019;30:871-3.
36. Zhang J, Yu Y, Li Y, Wei L. Diagnostic value of contrast-enhanced ultrasound in hepatocellular carcinoma: a meta-analysis with evidence from 1998 to 2016. Oncotarget 2017;8:75418-26.
37. Huang Y, Song J, Zheng J, et al. Comparison of hepatic resection combined with intraoperative radiofrequency Ablation, or hepatic resection alone, for hepatocellular carcinoma patients with multifocal tumors meeting the university of California san Francisco (UCSF) criteria: a propensity score-matched analysis. Ann Surg Oncol 2020;27:2334-45.
38. Lyshchik A, Kono Y, Dietrich CF, et al. Contrast-enhanced ultrasound of the liver: technical and lexicon recommendations from the ACR CEUS LI-RADS working group. Abdom Radiol (NY) 2018;43:861-79.
39. Putz FJ, Verloh N, Erlmeier A, et al. Influence of limited examination conditions on contrast-enhanced sonography for characterising liver lesions. Clin Hemorheol Microcirc 2019;71:267-76.
40. Greis C. Technical aspects of contrast-enhanced ultrasound (CEUS) examinations: tips and tricks. Clin Hemorheol Microcirc 2014;58:89-95.
41. Akdoğan E, Yılmaz FG. The role of acoustic radiation force impulse elastography in the differentiation of benign and malignant focal liver masses. Turk J Gastroenterol 2018;29:456-63.
42. Dong Y, Wang WP, Xu Y, et al. Point shear wave speed measurement in differentiating benign and malignant focal liver lesions. Med Ultrason 2017;19:259-64.
43. Wu JP, Shu R, Zhao YZ, et al. Comparison of contrast-enhanced ultrasonography with virtual touch tissue quantification in the evaluation of focal liver lesions. J Clin Ultrasound 2016;44:347-53.
44. Frulio N, Trillaud H, Perez P, et al. Acoustic radiation force impulse (ARFI) and transient elastography (TE) for evaluation of liver fibrosis in HIV-HCV co-infected patients. BMC Infect Dis 2014;14:405.
45. Taimr P, Klompenhouwer AJ, Thomeer MGJ, et al. Can point shear wave elastography differentiate focal nodular hyperplasia from hepatocellular adenoma. J Clin Ultrasound 2018;46:380-5.
46. Hu X, Huang X, Chen H, et al. Diagnostic effect of shear wave elastography imaging for differentiation of malignant liver lesions: a meta-analysis. BMC Gastroenterol 2019;19:60.
47. Hwang JA, Jeong WK, Song KD, Kang KA, Lim HK. 2-D Shear wave elastography for focal lesions in liver phantoms: effects of background stiffness, depth and size of focal lesions on stiffness measurement. Ultrasound Med Biol 2019;45:3261-8.
48. Ferraioli G, Wong VW, Castera L, et al. Liver ultrasound elastography: an update to the world federation for ultrasound in medicine and biology guidelines and recommendations. Ultrasound Med Biol 2018;44:2419-40.
50. Calderaro J, Seraphin TP, Luedde T, Simon TG. Artificial intelligence for the prevention and clinical management of hepatocellular carcinoma. J Hepatol 2022;76:1348-61.
51. Hassan TM, Elmogy M, Sallam ES. Diagnosis of focal liver diseases based on deep learning technique for ultrasound images. Arab J Sci Eng 2017:42,3127-40.
52. Yamakawa M, Shiina T, Nishida N, Kudo M. Computer aided diagnosis system developed for ultrasound diagnosis of liver lesions using deep learning. IEEE ;2019:2330-33.
53. Schmauch B, Herent P, Jehanno P, et al. Diagnosis of focal liver lesions from ultrasound using deep learning. Diagn Interv Imaging 2019;100:227-33.
54. Nishida N, Yamakawa M, Shiina T, et al. ; JSUM A. I. investigators. Artificial intelligence (AI) models for the ultrasonographic diagnosis of liver tumors and comparison of diagnostic accuracies between AI and human experts. J Gastroenterol 2022;57:309-21.
Cite This Article
Export citation file: BibTeX | RIS
OAE Style
Radu P, Dufour JF. Sonography in surveillance for HCC in NAFLD patients. Hepatoma Res 2022;8:38. http://dx.doi.org/10.20517/2394-5079.2022.42
AMA Style
Radu P, Dufour JF. Sonography in surveillance for HCC in NAFLD patients. Hepatoma Research. 2022; 8: 38. http://dx.doi.org/10.20517/2394-5079.2022.42
Chicago/Turabian Style
Radu, Pompilia, Jean Francois Dufour. 2022. "Sonography in surveillance for HCC in NAFLD patients" Hepatoma Research. 8: 38. http://dx.doi.org/10.20517/2394-5079.2022.42
ACS Style
Radu, P.; Dufour JF. Sonography in surveillance for HCC in NAFLD patients. Hepatoma. Res. 2022, 8, 38. http://dx.doi.org/10.20517/2394-5079.2022.42
About This Article
Special Issue
Copyright

Data & Comments
Data
0

 Cite This Article 12 clicks

 Like This Article 33
likes
Like This Article 33
likes


Comments
Comments must be written in English. Spam, offensive content, impersonation, and private information will not be permitted. If any comment is reported and identified as inappropriate content by OAE staff, the comment will be removed without notice. If you have any queries or need any help, please contact us at support@oaepublish.com.