
Clinicoradiographic predictors of progression of an intermediate hepatic lesion (LI-RADS 3) to hepatocellular carcinoma (LI-RADS 5)
 0
0Abstract
Aim: We sought to identify predictors of progression of an indeterminate observation (LI-RADS 3) to hepatocellular carcinoma (LI-RADS 5).
Methods: Imaging reports with LI-RADS (LR) assignments were identified among patients at the University of Washington, 2013-2017. Patients with an LR3 lesion and follow-up scan within 1 year of LR3 lesion date were included (n = 313). Features of interest were abstracted from chart review. Survival analyses employing interval censoring were performed, with variables potentially predictive of LR3 progression identified in univariate analyses. Backwards elimination (P < 0.05) was used to obtain the final multivariate model.
Results: 20.4% of LR3 lesions progressed to LR5; 73% remained LR3, 8% LR4. The cohort was predominantly male (61%), Caucasian (54%), older than 55 (63%). 47% had a history of hepatitis C virus (HCV), 33% with alcohol abuse, not mutually exclusive. Alpha-fetoprotein (AFP) at the time of LR3 scan was low if available (39% with AFP < 5, 29% unknown). CT was the most common exam (56%). Men (HR = 2.0, P = 0.02), earlier scan year (HR = 0.47 per year, P < 0.0001), and older age (HR = 1.48, P = 0.03), appeared as predictors of LR progression in the final model. HCV and alcohol use were more common among men but did not appear to explain the difference in LR progression by sex.
Conclusion: Our analysis is an early exploration of characteristics that may predict the risk of progression of an LR3 observation to hepatocellular carcinoma. Future efforts may allow for risk stratification to identify high-risk indeterminate lesions that may benefit from earlier intervention or more frequent surveillance.
Keywords
INTRODUCTION
The Liver Imaging Reporting and Data System (LI-RADS) was developed by expert consensus of the American College of Radiology to standardize reporting of liver imaging for patients at risk of hepatocellular carcinoma (HCC)[1,2]. The LI-RADS classification system was introduced in 2011 and has undergone revisions in 2013, 2014, 2017, and 2018[3,4]. The devised algorithm for diagnostic imaging incorporates imaging techniques and radiographic features on computed tomography (CT) and magnetic resonance imaging (MR) to assign a probability that a specific liver observation represents HCC. LI-RADS (LR) observations range in intervals from “1” (“definitely benign”) to “5” (“definitely HCC”) and include “M” (“malignant not definitely HCC”). LR observations have been incorporated in the American Academy of for the Study of Liver Diseases (AASLD) algorithm for the diagnosis of HCC[5], with an LR 5 observation (LR-5) considered diagnostic. An LR assignment of 3 (LR-3) is indicative of an “indeterminate” probability of HCC, with approximately 33% of LR-3 observations eventually upgraded to LR-5[5,6]. Current recommendations for the management of an LR-3 observation are to repeat diagnostic imaging within 3 to 6 months of the original imaging. If such a lesion develops features that are conclusive for HCC, i.e., LR-5, on subsequent scans, then there is consideration of locoregional therapies associated with good outcomes, e.g., partial hepatectomy, thermal ablation, with estimated 5-year overall survival of approximately 60%-80%[7]. Identification of clinicoradiographic factors associated with increased risk of progression of an LR-3 observation to a definitive HCC (i.e., LR-5) on subsequent imaging could be helpful in identifying cases that could merit earlier locoregional intervention or cases that could merit biopsy or closer monitoring with diagnostic imaging modalities to allow for more timely intervention. Our study represents an early exploration of potential clinicoradiographic characteristics that may be useful in identifying indeterminate hepatic observations at high risk for progression to HCC.
METHODS
CT and MR imaging reports generated within the University of Washington medical system from 2013 to 2017 were queried to locate imaging studies that identified hepatic observations with LR score assigned. A total of 6340 such scans were identified, representing 2602 patients. An augmented search tool was developed, utilizing available character functions to standardize, parse and highlight text to more easily locate the LR score or scores within the body of the report. It was decided a priori to record the highest LR score contained within the report when multiple observations were identified. Radiology reports with an LR-3 observation as the most advanced observation are hereafter referred to as the “LR-3 scan”. Patients were excluded if the LR-3 scan was preceded by a scan containing an LR-4 or LR-5 observation (treated or untreated), if there was no follow-up scan within 1 year of the date of the LR-3 scan, or if there was no documentation of cirrhosis or diagnosis of chronic hepatitis B virus (HBV) based on chart review [Figure 1]. The dates of each scan were obtained from the initial imaging report query.
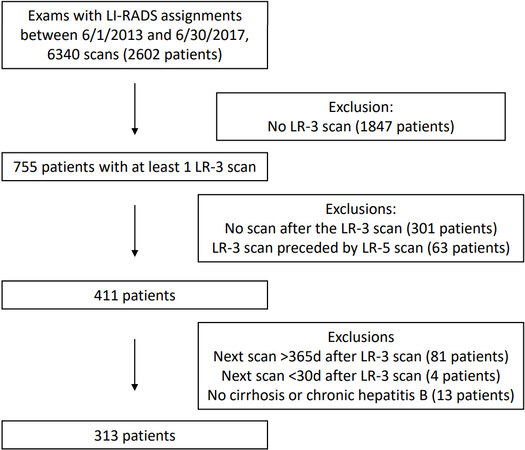
Figure 1. Study flowchart with exclusion criteria.
The texts of available clinical documentation, e.g., progress notes, for the included patients were queried using a variation of the aforementioned tool to abstract clinical characteristics of interest such as etiology of cirrhosis [e.g., hepatitis C virus (HCV), chronic HBV infection, excessive alcohol consumption, non-alcoholic steatohepatitis (NASH), autoimmune hepatitis], chronic HBV infection and sex. Age at a specific scan was calculated by obtaining the difference between date of birth and date of the scan. Laboratory values for alpha-fetoprotein (AFP), albumin, creatinine, and the dates of each laboratory value were obtained directly from the electronic medical record. For each scan, laboratory values that were obtained 30 days or less prior to the scan date were considered the laboratory value at the time of the specific scan. If there were multiple laboratory values within the 30-day period, then the laboratory value that resulted closest to the date of the scan was recorded. If there were no laboratory results available prior to a scan date, then laboratory results drawn within a 10-day period after the scan were recorded. The albumin-bilirubin (ALBI) grade[8] was used to approximate hepatic function at the time of each scan. The ALBI value was generated by the following equation: [log10 bilirubin (μmol/L) × 0.66] + [albumin (g/L) × -0.0852] with the grade assigned based on the value (grade 1: ALBI score ≤ -2.60, grade 2: > -2.60 to ≤ -1.39, and grade 3: > -1.39), with higher grades representing more advanced hepatic dysfunction. The texts of the radiology reports for the included patients were queried using a variation of the aforementioned tool to abstract radiographic characteristics of interest, e.g., solitary versus multiple LR-3 observations, size of LR-3 observations, site of observation within the liver, and vascularity (i.e., hypovascular, hypervascular). Missing data for each aforementioned characteristic were addressed by the addition of a “missing” category for each variable.
The outcome of interest was defined as progression of an LR-3 observation to an LR-5 observation within a 12-month time period on either CT or MR, hereafter referred to as “LR progression”. An LR-3 observation was considered to have progressed at the earliest date of subsequent CT or MR scan that identified the presence of an LR-5 observation, hereafter referred to as the “LR-5 scan”. The underlying time metric was defined as the time between the LR-3 scan date until either date of identification of the LR-5 observation or the date of the last scan obtained prior to 365 days post the LR-3 scan date. Independent validation of the findings of the published reports was not pursued. Independent validation that the lesion in question remained the same lesion observed in subsequent imaging studies was not pursued.
Differences between groups of interest were evaluated using χ2vs. Fisher Exact tests, as appropriate. Survival analyses with interval censoring were performed to assess the association between variables of interest and the outcome of interest, i.e., LR progression within one year, with hazard ratios (HR) and 95% confidence intervals (CI) were generated as the measure of association. Variables as potentially predictive of LR progression were identified in univariate analyses. For character variables of interest, the statistical significance of the measure of effect was ascertained by examination of the global P-value generated for the univariate model. For numerical variables, univariate models were constructed with the variable of interest in categories (e.g., age < 55, age 55 to 60, etc.; global P-value) as well as trend (e.g., the ordinal value assigned to the categories in the natural order; P-trend). Variables associated with the outcome of interest with either trend P-value or global P-value < 0.1 were considered as potential risk factors. The potential risk factors were then included in multivariate survival analysis with interval censoring, with backwards elimination utilized until all remaining variables were associated with a level of statistical significance of < 0.05 or less with the outcome of interest. Sub-analyses by sex and by etiology of cirrhosis were planned. The augmented searches and data analysis for this paper were performed using SAS software. Copyright © 2020. SAS Institute Inc. SAS and all other SAS Institute Inc. product or service names are registered trademarks or trademarks of SAS Institute Inc., Cary, NC, USA.
RESULTS
A total of 411 patients were identified with an LR-3 observation reported on imaging (LR-3 scan) that (1) was not preceded by a report of an LR-5 observation and (2) was followed by at least one scan. Further exclusions were made, including patients with no documentation of cirrhosis or documentation of chronic HBV on chart review, next scan > 365 days of the LR-3 scan, and next scan < 30 days of the LR-3 scan, leaving 313 patients. Of these patients, 15.3% had LR-3 scans with observations downgraded to LR-1 or LR-2 during the study period, 57.8% had scans with observations remaining as LR-3, and 6.3% and 20.4% had scans with observations upgraded to an LR-4 and LR-5, respectively. A total of 294 (93.9%) of the LR-3 imaging studies were performed within the University of Washington system, while the remaining 19 imaging studies were performed elsewhere but were overread by University of Washington radiology.
Most of the analytic cohort was male (61.3%), Caucasian (54.0%), and older than 55 (63.3%) [Table 1]. The most common etiologies of cirrhosis identified were HCV (46.7%) and excessive alcohol consumption (32.6%), not mutually exclusive. NASH and chronic HBV infection were rare (9.6% and 9.3%, respectively). The most common combinations of etiologies were HCV with excessive alcohol consumption (16.6%), followed by HBV with HCV (1.0%). A total of 90 (28.7%) patients were identified with HCV as the only identifiable etiology of cirrhosis, while 45 (14.4%) patients were identified with excessive alcohol consumption as the only identifiable etiology of cirrhosis. Only 1 patient was identified with documentation of three etiologies of cirrhosis: HCV, chronic HBV, and excessive alcohol consumption. The year of the LR-3 scan appeared evenly distributed from 2013 to 2016; only 6 LR-3 scans were identified in 2017, a consequence of the cut-off date imposed on the analytic cohort. At the time of the LR-3 scan, most patients were found with AFP values measuring less than or equal to 5 (39.0%) or between 5 and 10 (15.7%); 28.6% of patients had unknown AFP values at the time of the LR-3 scan. ALBI scores at the time of the LR-3 scan were primarily grade 1 (15.0%) or grade 2 (42.8%), i.e., lowest mortality risk and intermediate mortality risk from cirrhosis, respectively. A total of 153 (48.9%) LR-3 scans contained a single lesion assigned an LR score, with 50.8% having multiple lesions assigned as LR-3 or lower. Most lesions were localized to the right lobe of the liver (75.4%) and described as hypervascular (85.6%). Most lesions were subcentimeter (50.5%).
Baseline clinical and radiographic characteristics of the analytic cohort and associations with risk of progression to LR-3 to LR-5 within one year (univariate survival analyses with interval censoring)
| Characteristic | value | n (%) | Univariate modeling | ||
| HR (95%CI) | Global P-value | P-trend | |||
| Sex | Female Male | 121 (38.7) 192 (61.3) | 1.00 (reference) 2.01 (1.14-3.54) | 0.02 | N/A |
| Age at LR-3 scan | 18-54 55-64 65+ | 115 (36.7) 136 (43.5) 62 (19.8) | 1.00 (reference) 1.78 (0.98-3.25) 1.89 (0.95-3.79) | 0.11 | 0.06 |
| Race | Not white White Other/unknown | 60 (19.2) 169 (54.0) 84 (26.8) | 1.00 (reference) 1.26 (0.66-2.39) 0.42 (0.21-0.84) | 0.047 | N/A |
| Cirrhosis etiology*,± | HCV HBV Alcohol NASH Cryptogenic AIH Cardiac HCV + alcohol | 146 (46.7) 29 (9.3) 102 (32.6) 30 (9.6) 40 (12.8) 19 (6.1) 8 (2.6) 53 (16.9) | 1.63 (0.99-2.68) 1.35 (0.64-2.83) 1.37 (0.83-2.26) 0.80 (0.32-2.00) 0.63 (0.15-2.58) 0.23 (0.03-1.70) 0.60 (0.08-4.31) 2.05 (1.20-3.50) | 0.054 0.43 0.21 0.64 0.52 0.15 0.61 0.0089 | N/A |
| Year of LR-3 scan | 2013 2014 2015 2016 2017 | 87 (27.8) 76 (24.3) 80 (25.6) 64 (20.5) 6 (1.9) | 1.00 (reference) 0.21 (0.05-0.94) 0.13 (0.02-1.02) 0.10 (0.01-0.78) - | 0.03 | < 0.0001 |
| AFP at LR-3 scan | < 5 5 ≤ to < 10 10 ≤ to < 20 20 < Unknown | 122 (39.0) 49 (15.7) 22 (7.0) 30 (9.6) 90 (28.6) | 1.00 (reference) 1.05 (0.46-2.39) 2.75 (1.24-6.08) 2.53 (1.20-5.32) 1.20 (0.62-2.30) | 0.03 | 0.004≠ |
| ALBI score at LR-3 scan | 1 2 3 Unknown | 47 (15.0) 134 (42.8) 71 (22.7) 61 (19.5) | 1.00 (reference) 1.94 (0.80-4.71) 2.52 (1.01-6.29) 1.40 (0.51-3.88) | 0.18 | 0.04≠ |
| Scan type | CT MR | 177 (56.5) 136 (43.5) | 1.00 (reference) 0.71 (0.423-1.18) | 0.19 | N/A |
| Site of lesion (s)* | Left lobe Right lobe Dome Unknown | 58 (28.5) 236 (75.4) 10 (3.2) 32 (10.2) | 0.90 (0.48-1.69) 1.11 (0.55-2.25) - - | NS NS - - | N/A |
| Site of lesion, solitary lesions only | Left lobe Right lobe Dome Unknown | 21 (13.7) 116 (75.8) 7 (4.6) 8 (5.2) | 1.00 (reference) 0.98 (0.38-2.54) 1.29 (0.25-6.63) 0.90 (0.10-7.70) | 0.99 | N/A |
| Size of the lesion (largest)# | Sub centimeter 1.0-1.5 cm 1.6-2 cm > 2 cm Unknown | 158 (50.5) 92 (29.4) 28 (9.0) 23 (7.4) 12 (3.8) | 1.00 (reference) 2.03 (1.11-3.69) 1.27 (0.59-2.74) 3.62 (1.69-7.75) 1.22 (0.29-5.23) | 0.009 | 0.0002≠ |
| Size of lesion, solitary lesions only# | Sub centimeter 1.0-1.5 cm 1.6-2 cm > 2 cm Unknown | 69 (45.1) 53 (34.6) 11 (7.2) 13 (8.5) 7 (4.6) | 1.00 (reference) 2.06 (0.93-4.60) 2.59 (0.81-8.27) 3.21 (1.18-8.84) 1.96 (0.43-8.92) | 0.18 | 0.01≠ |
| Vascularity | Hypovascular Hypervascular Unknown | 30 (9.6) 268 (85.6) 15 (4.8) | 1.00 (reference) 0.84 (0.22-3.24) 0.86 (0.39-1.89) | 0.15 | N/A |
Liver biopsy data were available for twenty of the 313 patients included in our analysis. Among patients with biopsy data after LR progression, HCC was confirmed in 10 of 11 cases; no evidence of carcinoma was detected in one case. Among patients with biopsy data after LR-3 identification, no evidence of malignancy was detected in 8 of 9 cases; atypical HCC was detected in one case.
Univariate survival analyses with interval censoring are presented in Table 1. Compared to women, men appeared twice as likely to have imaging with LR progression (HR = 2.01, 95%CI: 1.14-3.54; P-value = 0.02). Earlier year of LR-3 scan (1 = 2013, 2 = 2014, 3 = 2015, 4 = 2016, 5 = 2017) and higher AFP values at the time of LR-3 scan (1 = less than 5, 2 = 5-10, 3 = 11-20, 4 = 20+) were significantly associated with increased risk of LR progression. Older age at LR-3 scan appeared associated with increased risk of LR progression, but the estimate of effect did not reach the level of statistical significance (P-trend = 0.06). Similarly, there was the suggestion that HCV was associated with increased risk of LR progression (HR = 1.63, 95%CI: 0.99-2.68; P-value = 0.054), but the level of statistical significance was not met. The risk of LR progression among those with both HCV and excessive alcohol consumption was HR = 2.05 (95%CI: 1.20-3.50; P-value = 0.0089) when compared to those without both vices. The risk of LR progression among those with both HCV and excessive alcohol consumption compared to those with only excessive alcohol consumption was HR = 2.56 (95%CI: 1.08-6.10; P-value = 0.0033). The risk of LR progression among those with both HCV and excessive alcohol consumption compared to those with only HCV was HR = 1.75 (95%CI: 0.92-3.35; P-value = 0.088). The increasing size of the identified lesion in the LR-3 scan was associated with an increased risk of LR progression (Wald global P-value = 0.009; P-trend = 0.0002). This was attenuated only slightly when limited to solitary lesions (Wald global P-value = 0.18; P-trend = 0.01). Of note, despite reaching the level of statistical significance for possible inclusion in the final model, the size of lesion was ineligible for inclusion given that it is a feature of the outcome (i.e., LR assignment). No association with LR progression was seen with LR-3 scan type (MR vs. CT), location of LR-3 observation, and vascularity of the LR-3 observation.
Backwards elimination [Table 2] yielded a multivariate model containing variables for sex, age at LR-3 scan (trend), and year of LR-3 scan (trend). The variable for a combination of HCV and excessive alcohol consumption was the last eliminated in the backwards elimination process, with a global P-trend of 0.059. As was seen in the univariate models, men, older age, and earlier year of scan were associated with increased risk of LR progression within one year. The estimate of effect for the association between sex and the outcome of interest appeared only mildly attenuated in the multivariate analysis compared to the univariate analysis.
Multivariate survival analyses with interval censoring, association of baseline clinical and radiographic characteristics, and risk of progression of LR-3 to LR-5 lesions after backwards elimination
| Characteristic | Value | Multivariate model | |
| HR (95%CI) | P-value | ||
| Sex | Female Male | 1.00 (reference) 2.14 (1.21-3.77) | 0.009 |
| Age at LR-3 scan | 18-54 (1) 55-64 (2) 65+ (3) | 1.48 (1.05-2.10) | 0.03 |
| Year of LR-3 scan | 2013 (1) 2014 (2) 2015 (3) 2016 (4) 2017 (5) | 0.47 (0.35-0.63) | < 0.0001 |
No statistically significant differences by sex were noted for the following variables: year of scan, age, race, AFP, ALBI, scan modality, single vs. multiple lesions, site of lesion, size of lesion, vascularity. Men were more likely to have chronic HCV than women (54.7% vs. 33.95%, respectively, χ2P-value = 0.0005), were more likely to have a history of excessive alcohol consumption (40.6% vs. 19.8%, P-value = 0.0001), and were less likely to have a diagnosis of autoimmune hepatitis (2.6% vs. 11.6%, P-value = 0.003) [Table 3]. The multivariate model of potential variables and increased risk of LR progression restricted to men was generated after backwards elimination and is presented in Table 4. As with the model containing both sexes, age at LR-3 scan and year of LR-3 scan are associated with increased risk of LR progression among the male-only cohort. The male-only model, however, also contains variables for race and AFP level. Among men, the unadjusted risk of LR progression among those with both a history of alcohol abuse and chronic HCV was significantly increased compared to those who did not have both vices (HR = 1.81, 95%CI: 1.01-3.24; P = 0.048). This was slightly attenuated when adjusted for age and year of LR-3 scan (HR = 1.80, 95%CI: 0.99-3.24; P-value = 0.052). Analyses restricted to female patients in this cohort were hampered by insufficient numbers. Analyses evaluating the association with alcohol abuse and chronic HCV with LR progression among women were not possible due to small numbers. The model generated after backwards elimination among women contained only one variable: year of LR-3 scan (HR = 0.38, 95%CI: 0.20-0.73; P-trend = 0.004).
Differences in clinical and radiographic characteristics at the time of LR-3 scan stratified by sex
| Characteristic | Value | Women n (%) | Men n (%) | χ2/Fisher Exact P-value |
| Age at LR-3 scan | 18-54 55-64 65+ | 45 (37.2) 50 (41.3) 26 (21.5) | 70 (36.5) 86 (44.8) 36 (18.8) | 0.77 |
| Race | Not white White Other/unknown | 28 (23.1) 62 (51.2) 31 (25.6) | 32 (16.7) 107 (55.7) 53 (27.6) | 0.38 |
| Cirrhosis etiology*,± | HCV HBV Alcohol NASH Cryptogenic AIH Cardiac HCV + alcohol | 41 (33.9) 8 (6.6) 24 (19.8) 20 (16.5) 4 (3.3) 14 (11.6) 7 (5.8) 7 (5.8) | 105 (54.7) 21 (10.9) 78 (40.6) 20 (10.4) 10 (5.2) 5 (2.6) 1 (0.5) 46 (24.0) | 0.0005 0.23 0.001 0.12 0.58 0.003 0.006 < 0.0001 |
| Year of LR-3 scan | 2013 2014 2015 2016 2017 | 35 (28.9) 30 (24.8) 23 (19.0) 30 (24.8) 3 (2.5) | 52 (27.1) 46 (24.0) 57 (29.7) 34 (17.7) 3 (1.6) | 0.22 |
| AFP at LR-3 scan | < 5 5 < to < 10 10 < to < 20 20 < Unknown | 53 (43.8) 21 (17.4) 13 (10.7) 7 (5.8) 27 (22.3) | 69 (35.9) 28 (14.6) 9 (4.7) 23 (12.0) 63 (32.8) | 0.02 |
| ALBI score at LR-3 scan | 1 2 3 Unknown | 15 (12.4) 54 (44.6) 31 (25.6) 21 (17.4) | 32 (16.7) 80 (41.7) 40 (20.8) 40 (20.8) | 0.53 |
| Scan type | CT MR | 66 (54.5) 55 (45.5) | 111 (57.8) 81 (42.2) | 0.64 |
| Site of lesion (s)* | Left lobe Right lobe Dome | 22 (18.2) 95 (78.5) 3 (17.6) | 36 (18.8) 141 (73.4) 7 (28.0) | 0.82 0.18 0.49 |
| Size of the lesion (largest)# | Sub centimeter 1.0-1.5 cm 1.6-2 cm > 2 cm Unknown | 66 (54.5) 28 (23.1) 10 (8,3) 9 (7.4) 8 (6.6) | 92 (47.9) 64 (33.3) 18 (9.4) 14 (7.3) 4 (2.1) | 0.12 |
| Vascularity | Hypovascular Hypervascular Unknown | 9 (7.4) 104 (86.0) 8 (6.6) | 21 (10.9) 164 (85.4) 7 (3.6) | 0.33 |
Multivariate survival analyses with interval censoring, association of baseline clinical and radiographic characteristics, and risk of progression of LR-3 to LR-5 lesions after backwards elimination, males only
| Characteristic | Value | Multivariate model | |
| HR (95%CI) | P-value | ||
| Age at LR-3 scan | 18-54 (1) 55-64 (2) 65+ (3) | 1.58 (1.02-2.45) | 0.038 |
| Year of LR-3 scan | 2013 (1) 2014 (2) 2015 (3) 2016 (4) 2017 (5) | 0.50 (0.36-0.70) | < 0.0001 |
| Race | Caucasian Not caucasian Missing | 1.53 (0.66-3.52) 1.00 (reference) 0.33 (0.14, 0.75) | 0.027 |
| AFP level | < 20 ≥ 20 Missing | 1.00 (reference) 1.29 (1.29-5.81) 1.58 (0.81-3.10) | 0.04 |
DISCUSSION
This retrospective study represents an early exploration of potential clinical and radiographic characteristics that may inform risk of an intermediate hepatic observation (LR-3) progression to that of a definitive HCC (LR-5) within a cohort of patients at risk of HCC. Characteristics selected for evaluation were those able to be abstracted readily from text-based clinical documentation and from laboratory results available within the medical record. This was imposed for practical purposes in consideration of future development of an LR lesion risk stratification tool readily usable by a clinician with access to a patient’s electronic medical record.
The clinical characteristics that appear significantly associated with increased risk of LR progression are earlier year of scan, older age, and male sex. The association between earlier years of scan and increased risk of LR progression is potentially attributable to changes to the LI-RADS criteria over time, with improved diagnostic performance noted in later versions[3,9]. The major imaging features used to assign an LI-RADS score are arterial-phase hyperenhancement, observation diameter, washout appearance, threshold growth, and capsule appearance (added in later versions)[1,10]. In LI-RADS v2011 criteria[11,12], an LR-5 observation was defined as either (1) an observation 1.0 to 1.9 cm in size with arterial phase hyperenhancement, delayed phase hyperenhancement and a greater than 1.0 cm diameter increase in one year or (2) an observation greater or equal to 2 cm with either delayed phase hyperenhancement or greater than 1.0 cm diameter increase in one year. In LI-RADS v2013 and v2014, the LR-5 category was modified to include separate categorizations of LR-5T (treated), LR-M (features suggestive of non-HCC malignancy), and LR-5V (mass with definite tumor in vein). Other significant changes included the addition of the presence of a capsule to the list of major features and a new definition of threshold growth, defined as diameter of observation at least 0.5 cm in size with either a greater than 50% increase within 6 months or a greater than 100% increase within 12 months. The LI-RADS version 2017[13,14] introduced new categories, including LR-NC (not categorizable) and LR-TIV (previously LR-5V) for LR-5 with tumor in vein. The definition of threshold growth was further altered, defined as size increase of observation by at least 0.5 cm and greater than 50% increase in size in 6 months or greater than 100% increase in size when reimaged after 6 months, or previously unseen but detected on subsequent imaging within a 2-year period and size greater than 1.0 cm. Additional alterations were made in v2018[15,16], with respect to the categorization of small observations (i.e., 1.0-1.9 cm) with arterial hyperenhancement: those with non-peripheral washout were now classified as LR-5, whereas previously had been classified as LR-5us if seen on antecedent surveillance ultrasound (US) or as LR-4 for all other observations. The definition for threshold growth was altered again, redefined as a 50% increase in diameter size within 6 months. The version of LI-RADS criteria used has significant implications in LR categorization for a particular scan. For example, in Chernyak et al.[4], significant discordance of LR categorizations was noted when scans for 398 patients were evaluated using both version 2017 and version 2018. A total of 40.1% of observations classified as LR-4 based on version 2017 criteria were upgraded to
Older age and male sex are both known risk factors of hepatocellular carcinoma[18,19] and were seen as associations with increased risk of LR progression in our analysis. Based on SEER registry data from 1992 to 2013[18], the incidence of HCC increases with each 5-year age range starting at age 20s before decreasing slightly after age 80. The increased risk of HCC among men compared to women is noted across all age ranges, with the male predominance attenuated at older ages but still persistent. The increased risk among men may be attributed to some extent to population-level differences in HCV exposure and alcohol use, but as in our small retrospective analysis, these differences in exposure do not appear to completely explain the differences in risk of HCC. A protective effect of female hormones has been theorized as a potential explanation to explain the male predominance of HCC[18,20,21]. There appears to be the suggestion of a synergistic effect with alcohol use and HCV infection and LR progression, similar to the synergism observed between alcohol and HCV on the risk of HCC[19,22]. Further exploration of this potential association with the risk of LR progression does require larger numbers. Established risk factors for HCC are likely to be risk factors for LR progression, but small numbers of individuals in our retrospective cohort with HBV infection, autoimmune hepatitis, cardiac cirrhosis, etc., preclude further analysis. Larger, more heterogeneous cohorts are needed for further evaluation.
Risk factors for LR progression have been explored in a few studies. In Shropshire et al.[23], ancillary radiographic features (e.g., restricted diffusion, hepatobiliary phase hypointensity, mild-moderate T2 hyperintensity) were not associated with LR-3 observation progression to either an LR-4 or LR-5 observation (LI-RADS v2017). In Cannella et al.[24], risk of progression to LR-5 or LRM among 109 LR-2, LR-3, and LR-4 observations did not appear associated with age, male gender, Child-Pugh status, AFP level, size of observation, or treatment with direct-acting antivirals among patients with viral hepatitis. The strongest association with LR progression was a more advanced LR score and presence of a non-peripheral “washout”. Using a subset of the cohort utilized in our analysis, Ojeda et al.[25], found no association between index exam modality (i.e., CT or MR) and risk of LR-3 to LR-5 progression, controlling for age and sex. Our analysis is the largest study to date of LR-3 observations and is one of the few studies to concentrate on more clinical predictors of LR progression. Our study was still limited by small numbers and did not include any ancillary radiographic features. Larger cohorts and the addition of more radiographic or ancillary features to risk stratification models could be helpful in future modeling efforts of risk of LR progression. Additional studies on this topic are warranted, with a potential goal of creating risk-stratification algorithms incorporating clinical variables to guide surveillance frequency or subsequent interventions for patients with LR-3 lesions.
The retrospective nature of the analysis is a significant limitation to this study, with the validity of the results likely affected. Excluded from the analyses were a significant number of patients who only had one imaging study within the University of Washington system, which does represent a significant source of selection bias. Most of the imaging studies were conducted at the University of Washington, with established imaging protocols utilized. While this does not guarantee uniformity of protocol and operator technique, it presumably lessens the variability. There were, however, some radiographic reports suggested that the imaging study has been conducted elsewhere and overread at our institution; this raises concern for increased variability in protocol and operator technique. As discussed previously, the change in LI-RADS criteria over time since the introduction of the initial algorithm represents a significant source of misclassification. The lack of independent review to confirm LI-RADS assignments and the lack of confirmation that the LR-3 observation in question represented the same lesion in subsequent scans are also potential sources of misclassification. Multiple LR-3 observations were allowed on the LR-3 scan, which does limit the evaluation of observation-specific characteristics, e.g., observation size, ancillary features, and their contribution to the risk of LR progression. The accuracy of the data abstracted from clinical documentation, e.g., cirrhosis etiology, depends on the accurate recording by the author of the documentation. While the presence or absence of HCV or HBV referenced in a progress note is likely accurate and can be confirmed by serologic values, information such as alcohol use is dependent on patient report and author interpretation. This also raises concern for exposure misclassification. As already referenced, a lack of sufficient numbers precluded stratified analyses and limited interpretation of more rare potential risk factors (e.g., chronic HBV infection), which also represents a significant limitation in our analysis. As already referenced, the lack of diversity among the patients included in this study limits the generalizability to larger populations.
In conclusion, our retrospective analysis is an early exploration of clinical and radiographic characteristics that may be associated with the risk of progression of an indeterminate liver observation to hepatocellular carcinoma. Risk stratification modeling involving characteristics available in the electronic medical record could be used to identify higher-risk intermediate lesions and prompt earlier intervention, biopsy for confirmation, or more frequent imaging. Earlier intervention or monitoring of such lesions would hopefully improve overall outcomes, but this also requires further evaluation.
DECLARATIONS
Authors’ contributionsData abstraction, data analysis and interpretation, manuscript author: Hannan LM
Contributed to conception and design and substantively reviewed and revised manuscript: Harris WP
Substantively reviewed and revised manuscript: Park JO
Performed data acquisition and made substantial contributions to the design of the study: Bhargava P, Ojeda PI, Mieloszyk RJ
Availability of data and materialsNot applicable.
Financial support and sponsorshipNone.
Conflicts of interestAll authors declared that there are no conflicts of interest.
Ethical approval and consent to participateNot applicable.
Consent for publicationNot applicable
Copyright© The Author(s) 2021.
REFERENCES
1. Marks RM, Masch WR, Chernyak V. LI-RADS: past, present, and future, from the AJR special series on radiology reporting and data systems. AJR Am J Roentgenol 2021;216:295-304.
2. Cunha GM, Fowler KJ, Abushamat F, Sirlin CB, Kono Y. Imaging diagnosis of hepatocellular carcinoma: the liver imaging reporting and data system, why and how? Clin Liver Dis 2020;24:623-36.
3. Ren AH, Zhao PF, Yang DW, Du JB, Wang ZC, Yang ZH. Diagnostic performance of MR for hepatocellular carcinoma based on LI-RADS v2018, compared with v2017. J Magn Reson Imaging 2019;50:746-55.
4. Chernyak V, Fowler KJ, Kamaya A, et al. Liver Imaging Reporting and Data System (LI-RADS) version 2018: imaging of hepatocellular carcinoma in at-risk patients. Radiology 2018;289:816-30.
5. Marrero JA, Kulik LM, Sirlin CB, et al. Diagnosis, staging, and management of hepatocellular carcinoma: 2018 practice guidance by the American Association for the Study of Liver Diseases. Hepatology 2018;68:723-50.
6. Hong CW, Park CC, Mamidipalli A, et al. Longitudinal evolution of CT and MRI LI-RADS v2014 category 1, 2, 3, and 4 observations. Eur Radiol 2019;29:5073-81.
7. Bruix J, Gores GJ, Mazzaferro V. Hepatocellular carcinoma: clinical frontiers and perspectives. Gut 2014;63:844-55.
8. Johnson PJ, Berhane S, Kagebayashi C, et al. Assessment of liver function in patients with hepatocellular carcinoma: a new evidence-based approach-the ALBI grade. J Clin Oncol 2015;33:550-8.
9. Kierans AS, Song C, Gavlin A, et al. Diagnostic performance of LI-RADS version 2018, LI-RADS version 2017, and OPTN criteria for hepatocellular carcinoma. AJR Am J Roentgenol 2020;215:1085-92.
10. Elsayes KM, Kielar AZ, Chernyak V, et al. LI-RADS: a conceptual and historical review from its beginning to its recent integration into AASLD clinical practice guidance. J Hepatocell Carcinoma 2019;6:49-69.
11. Elsayes KM, Kielar AZ, Agrons MM, et al. Liver Imaging Reporting and Data System: an expert consensus statement. J Hepatocell Carcinoma 2017;4:29-39.
12. Russo MW, Wald C. Radiological diagnosis of hepatocellular carcinoma. Clin Liver Dis (Hoboken) 2012;1:190-3.
13. The American College of Radiology LI-RADS v2017 Core. Available from: https://www.acr.org/Clinical-Resources/Reporting-and-Data-Systems/LI-RADS/Ultrasound-LI-RADS-v2017 [Last accessed on 10 Dec 2021].
14. Kielar AZ, Chernyak V, Bashir MR, et al. LI-RADS 2017: an update. J Magn Reson Imaging 2018;47:1459-74.
15. The American College of Radiology LI-RADS v2018 Core. Available from: https://www.acr.org/-/media/ACR/Files/RADS/LI-RADS/LI-RADS-2018-Core.pdf?la=en [Last accessed on 10 Dec 2021].
16. Elmohr M, Elsayes KM, Chernyak V. LI-RADS: review and updates. Clin Liver Dis (Hoboken) 2021;17:108-12.
17. Kanmaniraja D, Chernyak V. Liver imaging reporting and data system and CT/MRI diagnosis of hepatocellular carcinoma. Hepatoma Res 2020;6:51.
18. Liu P, Xie SH, Hu S, et al. Age-specific sex difference in the incidence of hepatocellular carcinoma in the United States. Oncotarget 2017;8:68131-7.
19. Lafaro KJ, Demirjian AN, Pawlik TM. Epidemiology of hepatocellular carcinoma. Surg Oncol Clin N Am 2015;24:1-17.
20. Shimizu I, Ito S. Protection of estrogens against the progression of chronic liver disease. Hepatol Res 2007;37:239-47.
21. McGlynn KA, Sahasrabuddhe VV, Campbell PT, et al. Reproductive factors, exogenous hormone use and risk of hepatocellular carcinoma among US women: results from the Liver Cancer Pooling Project. Br J Cancer 2015;112:1266-72.
22. Singal AK, Anand BS. Mechanisms of synergy between alcohol and hepatitis C virus. J Clin Gastroenterol 2007;41:761-72.
23. Shropshire E, Mamidipalli A, Wolfson T, et al. LI-RADS ancillary feature prediction of longitudinal category changes in LR-3 observations: an exploratory study. Abdom Radiol (NY) 2020;45:3092-102.
24. Cannella R, Vernuccio F, Celsa C, et al. Long-term evolution of LI-RADS observations in HCV-related cirrhosis treated with direct-acting antivirals. Liver Int 2021;41:2179-88.
Cite This Article
Export citation file: BibTeX | RIS
OAE Style
Hannan LM, Ojeda PI, Mieloszyk RJ, Harris WP, Park JO, Bhargava P. Clinicoradiographic predictors of progression of an intermediate hepatic lesion (LI-RADS 3) to hepatocellular carcinoma (LI-RADS 5). Hepatoma Res 2021;7:78. http://dx.doi.org/10.20517/2394-5079.2021.110
AMA Style
Hannan LM, Ojeda PI, Mieloszyk RJ, Harris WP, Park JO, Bhargava P. Clinicoradiographic predictors of progression of an intermediate hepatic lesion (LI-RADS 3) to hepatocellular carcinoma (LI-RADS 5). Hepatoma Research. 2021; 7: 78. http://dx.doi.org/10.20517/2394-5079.2021.110
Chicago/Turabian Style
Hannan, Lindsay M., Patricia I. Ojeda, Rebecca J. Mieloszyk, William P. Harris, James O. Park, Puneet Bhargava. 2021. "Clinicoradiographic predictors of progression of an intermediate hepatic lesion (LI-RADS 3) to hepatocellular carcinoma (LI-RADS 5)" Hepatoma Research. 7: 78. http://dx.doi.org/10.20517/2394-5079.2021.110
ACS Style
Hannan, LM.; Ojeda PI.; Mieloszyk RJ.; Harris WP.; Park JO.; Bhargava P. Clinicoradiographic predictors of progression of an intermediate hepatic lesion (LI-RADS 3) to hepatocellular carcinoma (LI-RADS 5). Hepatoma. Res. 2021, 7, 78. http://dx.doi.org/10.20517/2394-5079.2021.110
About This Article
Copyright

Data & Comments
Data
0

 Cite This Article 11 clicks

 Like This Article 4
likes
Like This Article 4
likes


Comments
Comments must be written in English. Spam, offensive content, impersonation, and private information will not be permitted. If any comment is reported and identified as inappropriate content by OAE staff, the comment will be removed without notice. If you have any queries or need any help, please contact us at support@oaepublish.com.