
Steatosis/steatohepatitis: how sustainable is the non-invasive instrumental differential diagnosis in clinical practice?

Abstract
Aim: Simple, rapid, and non-invasive methods for the early diagnosis of non-alcoholic steatohepatitis (NASH) in patients with fatty liver are an unmet need in clinical practice. Transient elastography (TE), commonly used for measuring liver stiffness (LS), which is significantly influenced by both liver fibrosis and inflammation is a promising tool.
Methods: We studied retrospectively the impact of TE in a cohort of 98 consecutive asymptomatic patients with fatty liver who underwent a liver biopsy [21 non-alcoholic fatty liver (NAFL) and 77 NASH] and TE on the same day at the Hepatology Unit of University Hospital of Pisa. Patients positive for HBsAg, anti-HCV, HIV, autoantibodies, drug-induced liver disease, Wilson’s disease, hemochromatosis, alpha-1 antitrypsin deficiency, type 2 diabetes, or neoplasia were excluded.
Results: NAFL patients were younger (42.5 years vs. 47.7 years, P = 0.02) and with lower BMI (25.5 kg/m2vs. 28.8 kg/m2, P < 0.001) than NASH patients. TE was higher in NASH than NAFL patients (8.1 kPa vs. 5.4 kPa, P = 0.01). Age, BMI, TE, and total/LDL cholesterol were statistically significantly different between NAFL and NASH patients, but with multivariate analysis only BMI (P = 0.009) and TE (P = 0.031) were independent predictors of NAFL/NASH with AUROCs of 0.771 and 0.754, respectively. A score combining TE and BMI (TE*BMI) showed the best AUROC (0.817, by De Long test, P = 0.01) to differentiate NAFL/NASH (P = 0.005).
Conclusion: Ultrasound based LS measure qualifies as a candidate tool for the early screening of NASH in fatty liver patients provided that its measure is properly standardized and tested in large prospective studies enrolling patients with different clinical and histological features.
Keywords
Introduction
Non-alcoholic fatty liver disease (NAFLD), defined as evidence of hepatic steatosis by imaging or histology, and lack of secondary causes of hepatic fat accumulation, occurs in about one-third of the general population in Europe and Italy and is characterized by a multifaceted pathogenesis well reviewed and discussed in the other contributions of this monograph. NAFLD behaves as a major morbidity and mortality risk factor; however, progression of liver disease as well as its associated complications occur almost invariably in patients in whom the additional burden of intrahepatic inflammation acts as disease accelerator[1-4]. NAFLD can be classified histologically in a less progressive form, namely non-alcoholic fatty liver (NAFL), characterized by the presence of steatosis without major hepatocellular inflammation or injury, and in a progressive form, nonalcoholic steatohepatitis (NASH) defined by the presence of steatosis and inflammation with hepatocyte ballooning regardless of fibrosis.
Recently, a new definition for NAFLD that takes into account the risk factors and clinical characteristics of subjects has been suggested; the proposed criteria for metabolic disfunction-associated fatty liver disease (MAFLD) are based on histological (biopsy), imaging, or blood biomarker evidence of fat accumulation in the liver (hepatic steatosis), in subjects with overweight/obesity or presence of type 2 diabetes mellitus. In lean or normal weight, non-diabetic individuals with steatosis, MAFLD is diagnosed when at least two metabolic abnormalities are present[5,6].
However, this new definition of MAFLD has not yet substituted NAFLD, because it has not been validated in a consensus conference accepted by all the major Hepatology and Diabetes Scientific Societies, thus we maintain the old, accepted nomenclature throughout all the manuscript.
NASH has an estimated incidence of 2%-3% per year in primary fatty liver disease[1-4]. Large-scale epidemiological studies and meta-analyses associated NASH with a higher risk of dying from hepatocellular carcinoma (HCC), even before the progression of liver disease to cirrhosis[4,7-13]. The association of HCC with NAFLD is alarming because of the high and increasing prevalence of fatty liver globally that could contribute to a rising HCC incidence in the near future. However, HCC develops only in patients with progressive steatohepatitis, thus the early non-invasive diagnosis of the presence of intrahepatic necro-inflammation with/without fibrosis is a very important issue in clinical practice. The complexity of the mechanisms involved in transition from NAFL and NASH was extensively studied in recent years and a great deal of new knowledge on the physiopathology of fatty liver was achieved[14-18]. All the most recent guidelines call for a new systems medicine approach and new concepts for patient stratification to identify different clinically significant profiles within the general context of NAFLD. Therefore, the identification of simple, sensitive, non-invasive biomarkers of intrahepatic inflammation is necessary to assess the individual risk of progression from NAFL to NASH and accordingly the individual HCC risk. On this premise liver stiffness (LS) that results from the combination of intrahepatic fibrosis, inflammation and vascular congestion represents a promising biomarker to assess the NAFL progression to NASH[19-24]. We report here the results of a single center retrospective study to evaluate the role of LS measured by transient elastography (TE) for the differential diagnosis between NAFL and NASH in consecutive asymptomatic patients who underwent a liver biopsy.
Methods
Patients
We studied 98 consecutive asymptomatic patients with NAFLD who underwent liver biopsy with a concomitant TE on the same day at the Hepatology Unit of University Hospital of Pisa between January 2006 and June 2020. Exclusion criteria were: infection with major hepatitis viruses (HBsAg or anti-HCV positive),positive HIV status, positive for autoantibodies (ANA, ASMA, and AMA), drug-induced liver disease, Wilson’s disease, hemochromatosis, alpha-1 antitrypsin deficiency, type 2 diabetes, or neoplasia.
The database for our cohort included information on patient characteristics (age, sex, and BMI), laboratory results (AST, ALT, GGT, ALP, blood count, plasma glucose, insulin, total cholesterol, HDL cholesterol, LDL cholesterol, and triglycerides), and LS values at the time of enrollment.
NAFLD Fibrosis score and FIB-4 were calculated respectively according with the following formulas: [1.675 + 0.037 × age (years) + 0.094 × BMI (kg/m2) + 1.13 × IFG/diabetes (yes 1, no 0) + 0.99 × AST/ALT ratio 0.013 × platelet (× 109/L) 0.66 × albumin (g/dl)] and {age [(years) × AST (U/L)]/[(PLT (× 109/L)] × [ALT (U/L)](1/2)}[25,26]. The study was performed in accordance with the ethical guidelines of the 1975 Declaration of Helsinki and an informed consent was obtained for the use of their clinic pathologic data for the scientific aims of this study.
Measurement of liver stiffness
LS was performed on the same day as liver biopsy after fasting for at least 8 h. LS was measured by FibroScan© (EchoSens, Paris, France). All measures were performed by expert physicians on the liver right lobes throughout intercostal spaces in patients lying on their back with right arm in maximal abduction. The ultrasound (US) guide was used to identify a target liver area, at least 6 cm thick without major vascular structures. The procedure was based on at least 10 validated measurements; the success rate (i.e., ratio between numbers of validated and total measurements) was > 60% with < 20% interquartile ranges. LS was recorded in kilopascals as the median value of all measurements.
Liver histology and diagnosis of NAFL and NASH
Liver biopsy were obtained using 16 G disposable needles (Hepafix; B. Braun, Melsungen, Germany). Liver specimens were fixed in formalin and embedded in paraffin, and then stained with hematoxylin-eosin. NAFL was defined with evidence of hepatic steatosis (> 5%) without evidence of hepatocellular injury in the form of hepatocyte ballooning. NASH was defined as hepatic steatosis and inflammation with hepatocyte injury (e.g., ballooning), with or without any fibrosis. Steatosis (from 0 to 3), ballooning (from 0 to 2), lobular inflammation (from 0 to 3), fibrosis (from 0 to 4), and NAFLD activity score (NAS) were scored using the NASH Clinical Research Network System[27,28]. NASH patients were divided into three groups based on NAFLD activity score (NAS): G1 = NAS 0-3, G2 = NAS 4-5, and G3 = NAS 6-8. All the specimens were greater than 1.5 cm in length and had at least 11 portal tracts.
Laboratory results
Serum biochemistry included aspartate amino-transferase (AST), alanine amino-transferase (ALT), AST/ALT ratio, gamma-glutamyl transpeptidase, alkaline phosphatase, blood count, plasma glucose, insulin, total cholesterol, LDL cholesterol, HDL cholesterol, and triglycerides. Tests were performed on fresh serum samples by routine procedures at the Central Laboratory of the Hospital (Roche, Cobas Analyser).
Statistical analysis
Measured values were expressed as mean with standard deviation or median with IQR for continuous variables and percentages/counts for categorical variables.
In the univariate analysis, comparisons of continuous variables between groups were determined using Student’s t-test and Mann-Whitney U test as appropriate.
The variables identified in univariate analysis were then introduced in a multiple logistic regression analysis.
Receiver operating characteristic (ROC) curves were computed for the most significant variables in the univariate analysis, and the respective areas under the curve (AUC) were compared using De Long test.
Contingency tables were constructed using cutoff values obtained minimizing Youden index of ROC curves. Based on results provided by the univariate analysis, the following multiparametric score was generated: Multi-Score = TE*BMI, and both univariate and ROC curves analysis were performed. The multiparametric score was used to predict NAFL/NASH category and a contingency table was generated.
Statistical analyses were carried out using IBM SPSS Statistics for Mac OsX version 26 (IBM Corp., Armonk, N.Y., USA) and MedCalc Statistical Software version 16.4.3 (MedCalc Software bv, Ostend, Belgium; https://www.medcalc.org; 2016).
Results
A total of 98 patients (21 NAFL and 77 NASH) with a mean age of 46.6 (SD = 11.2) and various stages of fibrosis were included (F0: 29, F1: 46, F2: 7, F3: 12, and F4: 4 patients). The population characteristics are reported in Table 1. NAFL subjects were younger (42.5 years vs. 47.7 years, P =0.02) and their BMI was lower (25.5 kg/m2vs. 28.8 kg/m2, P < 0.001) with respect to NASH patients. Furthermore, liver stiffness measured by TE was higher in the NASH group compared to NAFL (8.1 kPa vs. 5.4 kPa, P =0.01). Distribution of TE values in NASH patients stratified for staging and grading groups are reported in Figure 1 and Table 2. Total and LDL cholesterol levels, age, BMI, and TE were statistically significantly different between NAFL and NASH patients, while in the stepwise multivariate logistic regression final model, only BMI (P = 0.009) and TE (P = 0.031) were statistically significant independent predictors of NAFL/NASH group. ROC curves were generated for both BMI and TE and are reported in Figure 2, and AUC, sensitivity, specificity, and cutoff values are reported in Table 3.
Demographic, biochemical, and liver stiffness characteristics of non-alcoholic fatty liver and non-alcoholic steatohepatitis patients
| Characteristics | NAFL (n = 21) | NASH (n = 77) | P |
|---|---|---|---|
| Age (years) | 42.5 ± 8.0 | 47.7 ± 11.7 | 0.02 |
| Gender (male) | 17(81) | 53(69) | n.s. |
| BMI (kg/m2) | 25.5 ± 2.9 | 28.8 ± 3.4 | < 0.001 |
| AST | 30 [21] | 35.5 [23] | n.s. |
| ALT | 51 [35] | 55 [48] | n.s. |
| AST/ALT | 0.65 [0.53] | 0.66 [0.3] | n.s. |
| GGT | 56 [162] | 61.5 [93] | n.s. |
| ALP | 78 [67] | 74.5 [27] | n.s. |
| PLT | 247.4 ± 79.3 | 218.5 ± 58.5 | n.s. |
| Plasma glucose | 85 [28] | 86 [15.75] | n.s. |
| Insulin | 9.255 [8.16] | 12.96 [8.22] | n.s. |
| Total cholesterol | 215 [66.5] | 182 [58.5] | 0.017 |
| HDL cholesterol | 48 [21] | 45.5 [17.75] | n.s. |
| LDL cholesterol | 158 [53] | 121 [50.5] | 0.022 |
| Triglycerides | 125.5 [118.75] | 120 [68.5] | n.s. |
| TE (kPa) | 5.4 ± 0.9 | 8.1 ± 4.5 | 0.01 |
| NAFLD score | -0.855 ± 1.221 | -0.967 ± 1.298 | n.s. |
| FIB-4 | 1.134 ± 1.03 | 1.134 ± 0.607 | n.s. |
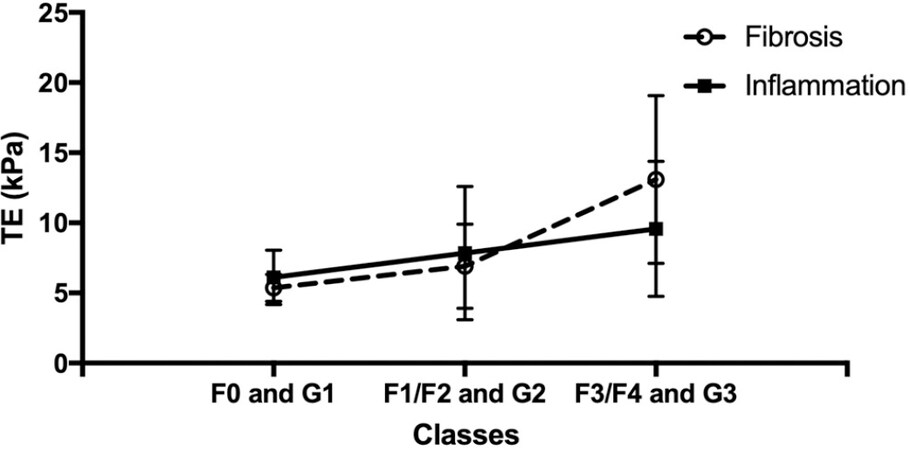
Figure 1. Plot of TE values (NASH patients only) according to histological staging (F0, F1/F2, and F3/F4) and grading (G1, G2, and G3). NASH: Non-alcoholic steatohepatitis.
TE values (NASH patients only) according to histological staging (F0, F1/F2, and F3/F4) and grading (G1, G2 and G3). Values are expressed as mean with standard deviation
| Staging | Grading | ||
|---|---|---|---|
| F0 | 5.37 (0.95) | G1 (NAS 0-3) | 6.12 (1.93) |
| F1/F2 | 6.9 (3.01) | G2 (NAS 4-5) | 7.84 (4.76) |
| F3/F4 | 13.1(59) | G3 (NAS 6-8) | 9.58 (4.81) |

Figure 2. ROC curves generated for BMI and TE.
AUC, sensitivity, specificity, and cutoff values of ROC curves generated for BMI and TE
| Test variable | AUC | Sensitivity | Specificity | Cut-off |
|---|---|---|---|---|
| BMI | 0.771 | 75.6% | 66.7% | 25.9 |
| TE | 0.754 | 72.7% | 75.0% | 5.75 |
Univariate, multivariate, and ROC analyses were repeated excluding subjects with BMI > 30 kg/m2. Again, age (P = 0.03), BMI (P = 0.017), and TE (P = 0.003) values were statistically different between NAFL and NASH patients; however, only TE (P = 0.005) was an independent predictor of patient’s group after multivariate logistic regression. AUC of ROC curves was 0.706 and 0.759 for BMI and TE, respectively.
Finally, the analysis was repeated selecting F0/F1 patients only. In this case, BMI (P = 0.004) was statistically different in NAFL/NASH groups at univariate analysis while TE (P = 0.067) only reached a borderline significance. After multivariate logistic regression analysis, only BMI (P =0 .009) was an independent predictor of the patient’s group.
Multiparametric score
A multiparametric score simply combining TE and BMI was generated (Multi-Score = TE*BMI). This score was able to statistically differentiate between NAFL/NASH groups (P = 0.005). The ROC curve of the multiparametric score is reported in Figure 3. Sensitivity and specificity of Multi-Score were 75.3% and 80% when a cutoff of 154.56 kPa•kg/m2 was considered, respectively. Furthermore, AUC of Multi-Score (0.817) was significantly higher when compared with AUC of TE (0.754) according to the De Long test (P =0.01).
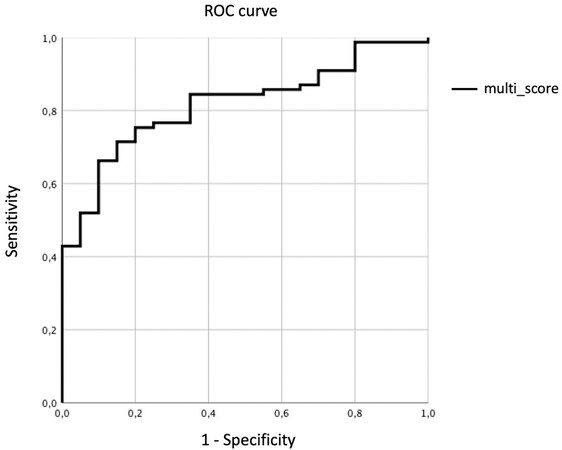
Figure 3. ROC curve of multiparametric score (TE*BMI). Multi-Scor = TE*BMI.
The classification performance as contingency table for the optimal point on ROC curve of the Multi-Score provided 75.3% sensitivity and 80% specificity using the cut-off of 154.56 kPa•kg/m2. Seventeen of 21 NAFL subjects were correctly classified, thus potentially limiting (80% reduction) the number of unnecessary biopsies, but conversely, 19 of 77 NASH subjects were erroneously classified as NAFL. Therefore, the ROC curve was analyzed to maximize the sensitivity: with the cutoff of 98.11 kPa•kg/m2 only 1 out of 77 NASH patients was erroneously classified as NAFL, whereas 16 NAFL were identified as NASH [Table 4], thus leading to sensitivity, specificity, PPV, NPV, and diagnostic accuracy of 82.6%, 83.3%, 98.7%, 23.8%, and 82.7%, respectively. Finally, all patients with TE < 5 kPa and BMI < 29 kg/m2 were selected, obtaining a subgroup of 15 patients. Table 5 reports the contingency table obtained using high-sensitivity cut-off of Multi-Score with these subjects. Accordingly, 4 of 6 unnecessary biopsies could be prevented while only 1 NASH patient was erroneously classified as NAFL.
Classification performances reported as contingency table for high sensibility point on ROC curve of the Multi-Score (TE*BMI). Cut-off of 98.11 kPa•kg/m2, sensitivity = 82.6%, specificity = 83.3%
| NAFL (predicted) | NASH (predicted) | Total | |
|---|---|---|---|
| NAFL (real) | 5 | 16 | 21 |
| NASH (real) | 1 | 76 | 77 |
| Total | 6 | 92 | 98 |
Classification performances reported as contingency table for the high sensitivity point on ROC curve of the Multi-Score (TE*BMI) in a subgroup of patient with TE < 5 kPa & BMI < 29 kg/m2. Cut-off of 98.11 kPa•kg/m2. Sensitivity 88.89%, specificity 66.67%
| NAFL (predicted) | NASH (predicted) | Total | |
|---|---|---|---|
| NAFL (real) | 4 | 2 | 6 |
| NASH (real) | 1 | 8 | 9 |
| Total | 5 | 10 | 15 |
Discussion
Liver stiffness is mainly an expression of hepatic fibrosis, but it is also influenced by inflammation, vascular congestion, and cholestasis[19-24].
Inflammation is the hallmark of NASH, and fibrosis develops as a consequence of long lasting intrahepatic inflammation that can be triggered by different pathways (e.g., fatty acid accumulation, bacterial endotoxin reaching the liver from the intestine, and damage-associated molecular patterns released from dying hepatocytes), activating the production of pro-inflammatory cytokines from Kupffer cells and macrophages that stimulate hepatic stellate cells to produce collagen, causing liver fibrosis. In addition, stellate cells produce leukocytes chemo-attractants, which maintain a vicious cycle of inflammation leading to further fibrosis. Thus, in NASH patients the measure of liver stiffness appears useful not only for detecting advanced liver disease where inflammation is combined with fibrosis, but also to identify patients with inflammation who have not yet developed significant fibrosis[29-33].
There are two main methods for measuring liver stiffness: ultrasound-based and magnetic resonance-based elastography techniques. In clinical practice the ultrasound-based technique is easier, cheaper, and thus the most widely used worldwide; the velocity of the shear waves detected by ultrasound is converted into a liver stiffness measurement, expressed in kilopascals (kPa) or in meters/second (m/s). Vibration-controlled transient elastography (TE) is the most common, but other elastography modalities exist (pSWE, 2D-SWE) using acoustic radiation force impulse technology (ARFI) which are integrated in conventional ultrasound systems[34-36]. In our study, we found that after a stepwise multivariate logistic regression, TE was the only statistically significant independent predictor of NAFL/NASH other than the well-known BMI. ROC analysis using a 5.75-kPa threshold of LS showed a 72.7% sensitivity and 75% specificity for discriminating NASH from NAFL (AUROC = 0.754). Similar data emerged also for BMI that, as expected, correlates with the risk of metabolic syndrome, including NASH[37,38].
Interestingly, after multivariate logistic regression, LS can still distinguish NASH from NAFL groups, even if considering only patients with BMI < 30 kg/m2, suggesting that TE can be proposed as a valuable tool for prediction of NASH in lean/overweight NAFL patients. Prospective clinical studies are needed to test the TE diagnostic accuracy in this important clinical setting.
On the other hand, the ability of TE to differentiate the two studied groups failed when we considered only patients with low fibrosis stages (F0-F1). This finding stems from the well-established evidence that hepatic fibrosis prevails over inflammation in determining LS values. Moreover, we have to take into account the evidence provided by Petta et al.[39] that in NAFLD patients with poor fibrosis, severe steatosis can overestimate the values of LS assessed by TE resulting in a “gray area” in which steatosis overlaps with inflammation. Thus, it is not unexpected that TE at low threshold could not discriminate hepatic intraparenchymal inflammation to distinguish NASH from NAFL.
Combining the two parameters, TE and BMI, in a simple Multi-Score (TE*BMI) results in AUC (0.817), significantly higher when compared with AUC of TE alone (0.754). Using the optimal point on ROC curve of the Multi-Score (sensitivity = 75.3%; specificity = 75.3%; cut-off = 154.56 kPa•kg/m2), 17 out of 21 NAFL subjects were correctly diagnosed, with an 80% reduction in the number of unnecessary biopsies; on the other hand, 19 out 77 NASH patients were incorrectly classified, resulting in 25 % of misdiagnosis in subjects with progressive liver disease.
In order to improve the ability of the Multi-Score to identify patients with NASH, ROC curve was analyzed to maximize the sensitivity (sensitivity = 82.6%; specificity = 83.3%; cut-off 98.11 kPa•kg/m2). In such a way the diagnosis of NASH was consistently ameliorated as only 1 out of 77 NASH was erroneously classified as NAFL, whereas only 5 out of 21 NAFL were correctly identified, with a 24% reduction of unnecessary biopsies. Interestingly this high sensitivity cut-off when applied in the subgroup of patients with low risk profile for NASH (15 patients with TE < 5 kPa and BMI < 29 kg/m2) allowed the correct classification of 4 out of 6 NAFL, missing only 1 diagnosis of NASH. Currently, a high accuracy for early diagnosis of NASH is an unmet need; in our cohort with a low prevalence of patients with significant liver fibrosis (F3-F4 = 16 out 98 patients), both NAFLD fibrosis score and FIB-4, the most widely used multiparametric scores to identify NASH patients in NAFLD subjects, failed to distinguish NAFL from NASH.
In a previous work Lee at al.[40] demonstrated in 183 subjects who underwent liver biopsy (NASH = 94; without NASH = 89) that ALT level, LS value, and controlled attenuation parameter (CAP) value were all significantly higher in patients with NASH than those without NASH (P < 0.05). The authors identified a CAP value greater than 250 dB/m (OR = 4.133, 95%CI: 1.037-16.470), an LS value greater than 7 kPa (OR = 3.399, 95%CI: 1.295-8.291), and an ALT level greater than 60 IU/L (OR = 7.557, 95%CI: 2.997-19.059) as independent predictors of NASH. Using these three independent predictors they proposed a score, “CLA” for the non-invasive characterization of patients with metabolic liver disease (AUC 0.812)[31]. The lower mean TE values and cut-offs, and the lack of a significant difference between ALT levels in our patients suggest that our cohort differs significantly because we excluded more severe patients. Unfortunately in our study we did not include the CAP measures because, due to the retrospective nature of the study, they were not available for patients biopsied before January 2017 (77 out 91 patients)[40].
However, in our cases with low and intermediate levels of steatosis the use of CAP would have been limited by its poor accuracy in detecting the different grades of steatosis e by discordant results depending by the type of probe used (M or XL)[41]. Certainly, the rapid, non-invasive, and accurate simultaneous measurement of liver fat (LF) and hepatic stiffness should bring enormous advantages in the knowledge and characterization of NAFLD patients[42-47]. Recently Di Lascio et al.[48] Combined five different parameters obtained after processing of standard US images and proposed a simple non-invasive quantitative multiparametric measure of LF, worthy of further validation in large-cohort clinical trials. So far, magnetic resonance imaging-derived proton density fat fraction remains the gold standard for the non-invasive measure of liver fat and MRI-elastography and multiparametric MRI technology provides a highly accurate fibrosis-inflammatory index for the non-invasive differential diagnosis between NAFLD and NASH. These methods demonstrated good specificity and sensitivity in detecting patients with steatohepatitis even in absence of fibrosis[49-54]. However, the poor availability and high costs of MRIs limit their use in the every-day clinical practice.
Acoustic radiation force impulse (ARFI) technology, as alternative ultrasound based elastography technique, showed a good correlation with liver biopsy on 32 patients with morbid obesity who underwent bariatric surgery[55]. ARFI results differed in patients with simple steatosis, inflammation, and fibrosis, and the cut-off proposed for differentiating NAFL from NASH or fibrosis was 0.899 (optimal cut-off value 1.3 m/s; sensitivity 85 %; specificity 83.3 %). Similarly, on 64 patients with histologically proven NAFLD, ARFI elastography proved suitable for distinguishing patients with NASH from those with NAFL, with an AUC of 0.867 (95%CI: 0.782-0.953). Additionally, in this study which considered patients with advanced liver disease as well, there was a highly significant correlation (r = 0.843) between ARFI elastography measurements and fibrosis (P < 0.001) as expected[56]. The advantages of ARFI are that it is widely available on the new ultrasound machines (i) and that is possible to select the part of the hepatic parenchyma to perform the measurement (ii); thus, a widespread use of elastography by ARFI is expected to occur in the near future in NAFLD patients. Currently, there is an unmet need for the standardization of LS measurement by ARFI using different instruments and stratifying patients based on the presence and absence of cirrhosis.
In conclusion, elastography techniques to measure LS appear promising useful tools to be used in clinical practice for the early screening of NAFLD patients. In particular, the analysis of the trend of TE values based on different degrees of histological grading and staging in NASH patients shows that LS increases in parallel for both parameters, but with a steeper trend in the presence of significant fibrosis [Figure 1, FS > 10 KpA, F3/F4]. These data confirm the rationale for using elastography to screen for the initial stages of liver disease in patients with fatty liver, exploiting the ability of TE to provide a reliable index combining both inflammation and fibrosis[23].
Both TE and ARFI technology showed similar performance in distinguishing NAFL from NASH, but the use of different measurement techniques along with the lack of standardized measurement procedures, and the availability of data from small cohorts with different clinical and demographic characteristics, do not currently allow the identification of a widely usable thresholds.
The simultaneous measurement of intrahepatic fat could represent a step-forward in the initial characterization of NAFLD patients. The new generation ultrasound systems in which the elastography is incorporated along with the development of a multiparametric measurement of liver fat using ultrasound could help the clinicians to categorize non-cirrhotic patients with NAFLD. Provided that reliable standardized cut-offs for non-invasive LF measurement are identified we could hypothesize four major “phenotypes”: (1) high LF and high LS (> 10 KpA) = very high probability of having NASH → a specialist visit is required; (2) high LF and low LS (5-10 KpA) = patient a risk of having NASH → further diagnostic investigations and/or clinical monitoring; (3) Low LF and high LS (> 10 KpA) = consider other etiologies of liver disease; and (4) low LF and low LS (≤ 5 KpA) = absence of progressive liver disease.
Declarations
Authors’ contributionsMade substantial contributions to conception and design of the study and performed data analysis and interpretation: Salvati A, Faita F, Bonino F, Brunetto MR
Performed data acquisition, as well as provided administrative, technical, and material support: Cavallone D, Ricco G, Colombatto P, Coco B, Romagnoli V
Availability of data and materialsThe data that support the findings of this study are available from the corresponding author upon reasonable request.
Financial support and sponsorshipNone.
Conflicts of interestBrunetto MR has served as a speaker for AbbVie, Gilead, Janssen and as an advisory board member for Abbott, AbbVie, Gilead, Janssen, Roche and Biotest; Bonino F has served as a speaker for Fujirebio, Gilead and Roche; All other authors have no conflicts of interest to declare.
Ethical approval and consent to participateThe study was performed in accordance with the ethical guidelines of the 1975 Declaration of Helsinki and an informed consent was obtained for the use of their clinic pathologic data for the scientific aims of this study.
Consent for publicationThe study was obtained for the use of their clinic pathologic data for the scientific aims of this study.
Copyright© The Author(s) 2021.
REFERENCES
1. Williams CD, Stengel J, Asike MI, et al. Prevalence of nonalcoholic fatty liver disease and nonalcoholic steatohepatitis among a largely middle-aged population utilizing ultrasound and liver biopsy: a prospective study. Gastroenterology 2011;140:124-31.
2. Zelber-Sagi S, Nitzan-Kaluski D, Halpern Z, Oren R. Prevalence of primary non-alcoholic fatty liver disease in a population-based study and its association with biochemical and anthropometric measures. Liver Int 2006;26:856-63.
3. Younossi ZM, Koenig AB, Abdelatif D, Fazel Y, Henry L, Wymer M. Global epidemiology of nonalcoholic fatty liver disease-Meta-analytic assessment of prevalence, incidence, and outcomes. Hepatology 2016;64:73-84.
4. Younossi Z, Tacke F, Arrese M, et al. Global perspectives on nonalcoholic fatty liver disease and nonalcoholic steatohepatitis. Hepatology 2019;69:2672-82.
5. Eslam M, Sanyal AJ, George J; International Consensus Panel. MAFLD: a consensus-driven proposed nomenclature for metabolic associated fatty liver disease. Gastroenterology 2020;158:1999-2014.e1.
6. Eslam M, Newsome PN, Sarin SK, et al. A new definition for metabolic dysfunction-associated fatty liver disease: An international expert consensus statement. J Hepatol 2020;73:202-9.
7. Adams LA, Lymp JF, St Sauver J, et al. The natural history of nonalcoholic fatty liver disease: a population-based cohort study. Gastroenterology 2005;129:113-21.
8. Ascha MS, Hanouneh IA, Lopez R, Tamimi TA, Feldstein AF, Zein NN. The incidence and risk factors of hepatocellular carcinoma in patients with nonalcoholic steatohepatitis. Hepatology 2010;51:1972-8.
9. Ertle J, Dechêne A, Sowa JP, et al. Non-alcoholic fatty liver disease progresses to hepatocellular carcinoma in the absence of apparent cirrhosis. Int J Cancer 2011;128:2436-43.
10. Baffy G, Brunt EM, Caldwell SH. Hepatocellular carcinoma in non-alcoholic fatty liver disease: an emerging menace. J Hepatol 2012;56:1384-91.
11. Wong RJ, Aguilar M, Cheung R, et al. Nonalcoholic steatohepatitis is the second leading etiology of liver disease among adults awaiting liver transplantation in the United States. Gastroenterology 2015;148:547-55.
12. Ekstedt M, Hagström H, Nasr P, et al. Fibrosis stage is the strongest predictor for disease-specific mortality in NAFLD after up to 33 years of follow-up. Hepatology 2015;61:1547-54.
13. White DL, Thrift AP, Kanwal F, Davila J, El-Serag HB. Incidence of hepatocellular carcinoma in all 50 united states, from 2000 through 2012. Gastroenterology 2017;152:812-20.e5.
14. Brouwers MC, van Greevenbroek MM, Cantor RM. Heritability of nonalcoholic fatty liver disease. Gastroenterology 2009;137:1536.
15. Lambert JE, Ramos-Roman MA, Browning JD, Parks EJ. Increased de novo lipogenesis is a distinct characteristic of individuals with nonalcoholic fatty liver disease. Gastroenterology 2014;146:726-35.
16. Schnabl B, Brenner DA. Interactions between the intestinal microbiome and liver diseases. Gastroenterology 2014;146:1513-24.
17. Brunt EM, Wong VW, Nobili V, et al. Nonalcoholic fatty liver disease. Nat Rev Dis Primers 2015;1:15080.
18. Diehl AM, Day C. Cause, pathogenesis, and treatment of nonalcoholic steatohepatitis. N Engl J Med 2017;377:2063-72.
19. Sandrin L, Fourquet B, Hasquenoph JM, et al. Transient elastography: a new noninvasive method for assessment of hepatic fibrosis. Ultrasound Med Biol 2003;29:1705-13.
20. Coco B, Oliveri F, Maina AM, et al. Transient elastography: a new surrogate marker of liver fibrosis influenced by major changes of transaminases. J Viral Hepat 2007;14:360-9.
21. Millonig G, Friedrich S, Adolf S, et al. Liver stiffness is directly influenced by central venous pressure. J Hepatol 2010;52:206-10.
22. Millonig G, Reimann FM, Friedrich S, et al. Extrahepatic cholestasis increases liver stiffness (FibroScan) irrespective of fibrosis. Hepatology 2008;48:1718-23.
23. Bonino F, Arena U, Brunetto MR, et al; Liver Stiffness Study Group ‘Elastica’ of the Italian Association for the Study of the Liver. Liver stiffness, a non-invasive marker of liver disease: a core study group report. Antivir Ther 2010;15 Suppl 3:69-78.
24. Chapman T, Dubinsky T, Barr RG. Ultrasound elastography of the liver: what the clinician needs to know. J Ultrasound Med 2017;36:1293-304.
25. Angulo P, Hui JM, Marchesini G, et al. The NAFLD fibrosis score: a noninvasive system that identifies liver fibrosis in patients with NAFLD. Hepatology 2007;45:846-54.
26. Sterling RK, Lissen E, Clumeck N, et al; APRICOT Clinical Investigators. Development of a simple noninvasive index to predict significant fibrosis in patients with HIV/HCV coinfection. Hepatology 2006;43:1317-25.
27. Chalasani N, Younossi Z, Lavine JE, et al. The diagnosis and management of non-alcoholic fatty liver disease: practice Guideline by the American Association for the Study of Liver Diseases, American College of Gastroenterology, and the American Gastroenterological Association. Hepatology 2012;55:2005-23.
28. Kleiner DE, Brunt EM, Van Natta M, et al; Nonalcoholic Steatohepatitis Clinical Research Network. Design and validation of a histological scoring system for nonalcoholic fatty liver disease. Hepatology 2005;41:1313-21.
29. Seki E, De Minicis S, Osterreicher CH, et al. TLR4 enhances TGF-beta signaling and hepatic fibrosis. Nat Med 2007;13:1324-32.
30. Syn WK, Oo YH, Pereira TA, et al. Accumulation of natural killer T cells in progressive nonalcoholic fatty liver disease. Hepatology 2010;51:1998-2007.
31. Feldstein AE, Canbay A, Angulo P, et al. Hepatocyte apoptosis and fas expression are prominent features of human nonalcoholic steatohepatitis. Gastroenterology 2003;125:437-43.
32. Wolf MJ, Adili A, Piotrowitz K, et al. Metabolic activation of intrahepatic CD8 + T cells and NKT cells causes nonalcoholic steatohepatitis and liver cancer via cross-talk with hepatocytes. Cancer Cell 2014;26:549-64.
33. Mehal WZ. The inflammasome in liver injury and non-alcoholic fatty liver disease. Dig Dis 2014;32:507-15.
34. Kennedy P, Wagner M, Castéra L, et al. Quantitative elastography methods in liver disease: current evidence and future directions. Radiology 2018;286:738-63.
36. Tapper EB, Loomba R. Noninvasive imaging biomarker assessment of liver fibrosis by elastography in NAFLD. Nat Rev Gastroenterol Hepatol 2018;15:274-82.
37. Lusis AJ, Attie AD, Reue K. Metabolic syndrome: from epidemiology to systems biology. Nat Rev Genet 2008;9:819-30.
38. Pouliot M, Després J, Lemieux S, et al. Waist circumference and abdominal sagittal diameter: Best simple anthropometric indexes of abdominal visceral adipose tissue accumulation and related cardiovascular risk in men and women. Am J Cardiol 1994;73:460-8.
39. Petta S, Maida M, Macaluso FS, et al. The severity of steatosis influences liver stiffness measurement in patients with nonalcoholic fatty liver disease. Hepatology 2015;62:1101-10.
40. Lee HW, Park SY, Kim SU, et al. Discrimination of nonalcoholic steatohepatitis using transient elastography in patients with nonalcoholic fatty liver disease. PLoS One 2016;11:e0157358.
41. Castera L, Friedrich-Rust M, Loomba R. Noninvasive assessment of liver disease in patients with nonalcoholic fatty liver disease. Gastroenterology 2019;156:1264-81.e4.
42. Polyzos SA, Kountouras J, Mantzoros CS. Adipokines in nonalcoholic fatty liver disease. Metabolism 2016;65:1062-79.
43. Polyzos SA, Kountouras J, Zavos C. Nonalcoholic fatty liver disease: the pathogenetic roles of insulin resistance and adipocytokines. Curr Mol Med 2009;9:299-314.
44. Mota M, Banini BA, Cazanave SC, Sanyal AJ. Molecular mechanisms of lipotoxicity and glucotoxicity in nonalcoholic fatty liver disease. Metabolism 2016;65:1049-61.
45. Buzzetti E, Pinzani M, Tsochatzis EA. The multiple-hit pathogenesis of non-alcoholic fatty liver disease (NAFLD). Metabolism 2016;65:1038-48.
46. Nati M, Haddad D, Birkenfeld AL, Koch CA, Chavakis T, Chatzigeorgiou A. The role of immune cells in metabolism-related liver inflammation and development of non-alcoholic steatohepatitis (NASH). Rev Endocr Metab Disord 2016;17:29-39.
47. Boutari C, Perakakis N, Mantzoros CS. Association of Adipokines with Development and Progression of Nonalcoholic Fatty Liver Disease. Endocrinol Metab (Seoul) 2018;33:33-43.
48. Di Lascio N, Avigo C, Salvati A, et al. Steato-Score: Non-Invasive Quantitative Assessment of Liver Fat by Ultrasound Imaging. Ultrasound Med Biol 2018;44:1585-96.
49. Chen J, Talwalkar JA, Yin M, Glaser KJ, Sanderson SO, Ehman RL. Early detection of nonalcoholic steatohepatitis in patients with nonalcoholic fatty liver disease by using MR elastography. Radiology 2011;259:749-56.
50. Gallego-Durán R, Cerro-Salido P, Gomez-Gonzalez E, et al. Imaging biomarkers for steatohepatitis and fibrosis detection in non-alcoholic fatty liver disease. Sci Rep 2016;6:31421.
51. Costa-Silva L, Ferolla SM, Lima AS, Vidigal PVT, Ferrari TCA. MR elastography is effective for the non-invasive evaluation of fibrosis and necroinflammatory activity in patients with nonalcoholic fatty liver disease. Eur J Radiol 2018;98:82-9.
52. Pavlides M, Banerjee R, Tunnicliffe EM, et al. Multiparametric magnetic resonance imaging for the assessment of non-alcoholic fatty liver disease severity. Liver Int 2017;37:1065-73.
53. Eddowes PJ, McDonald N, Davies N, et al. Utility and cost evaluation of multiparametric magnetic resonance imaging for the assessment of non-alcoholic fatty liver disease. Aliment Pharmacol Ther 2018;47:631-44.
54. Kim JW, Lee YS, Park YS, et al. Multiparametric MR Index for the Diagnosis of Non-Alcoholic Steatohepatitis in Patients with Non-Alcoholic Fatty Liver Disease. Sci Rep 2020;10:2671.
55. Guzmán-Aroca F, Frutos-Bernal MD, Bas A, et al. Detection of non-alcoholic steatohepatitis in patients with morbid obesity before bariatric surgery: preliminary evaluation with acoustic radiation force impulse imaging. Eur Radiol 2012;22:2525-32.
Cite This Article
Export citation file: BibTeX | RIS
OAE Style
Salvati A, Faita F, Cavallone D, Ricco G, Colombatto P, Coco B, Romagnoli V, Oliveri F, Bonino F, Brunetto MR. Steatosis/steatohepatitis: how sustainable is the non-invasive instrumental differential diagnosis in clinical practice?. Hepatoma Res 2021;7:14. http://dx.doi.org/10.20517/2394-5079.2020.115
AMA Style
Salvati A, Faita F, Cavallone D, Ricco G, Colombatto P, Coco B, Romagnoli V, Oliveri F, Bonino F, Brunetto MR. Steatosis/steatohepatitis: how sustainable is the non-invasive instrumental differential diagnosis in clinical practice?. Hepatoma Research. 2021; 7: 14. http://dx.doi.org/10.20517/2394-5079.2020.115
Chicago/Turabian Style
Salvati, Antonio, Francesco Faita, Daniela Cavallone, Gabriele Ricco, Piero Colombatto, Barbara Coco, Veronica Romagnoli, Filippo Oliveri, Ferruccio Bonino, Maurizia Rossana Brunetto. 2021. "Steatosis/steatohepatitis: how sustainable is the non-invasive instrumental differential diagnosis in clinical practice?" Hepatoma Research. 7: 14. http://dx.doi.org/10.20517/2394-5079.2020.115
ACS Style
Salvati, A.; Faita F.; Cavallone D.; Ricco G.; Colombatto P.; Coco B.; Romagnoli V.; Oliveri F.; Bonino F.; Brunetto MR. Steatosis/steatohepatitis: how sustainable is the non-invasive instrumental differential diagnosis in clinical practice?. Hepatoma. Res. 2021, 7, 14. http://dx.doi.org/10.20517/2394-5079.2020.115
About This Article
Special Issue
Copyright

Data & Comments
Data


 Cite This Article 9 clicks

 Like This Article 10
likes
Like This Article 10
likes


Comments
Comments must be written in English. Spam, offensive content, impersonation, and private information will not be permitted. If any comment is reported and identified as inappropriate content by OAE staff, the comment will be removed without notice. If you have any queries or need any help, please contact us at support@oaepublish.com.